Walkthrough
ChartKit product walkthrough
This is the practical workflow for teams that want to go from extension install to a clear, management-ready chart inside Google Slides without building a custom spreadsheet pipeline.
Step by step
1. Install the extension
Start from the Chrome Web Store and open the extension in the Google Workspace file where you are already working.
2. Choose the chart type
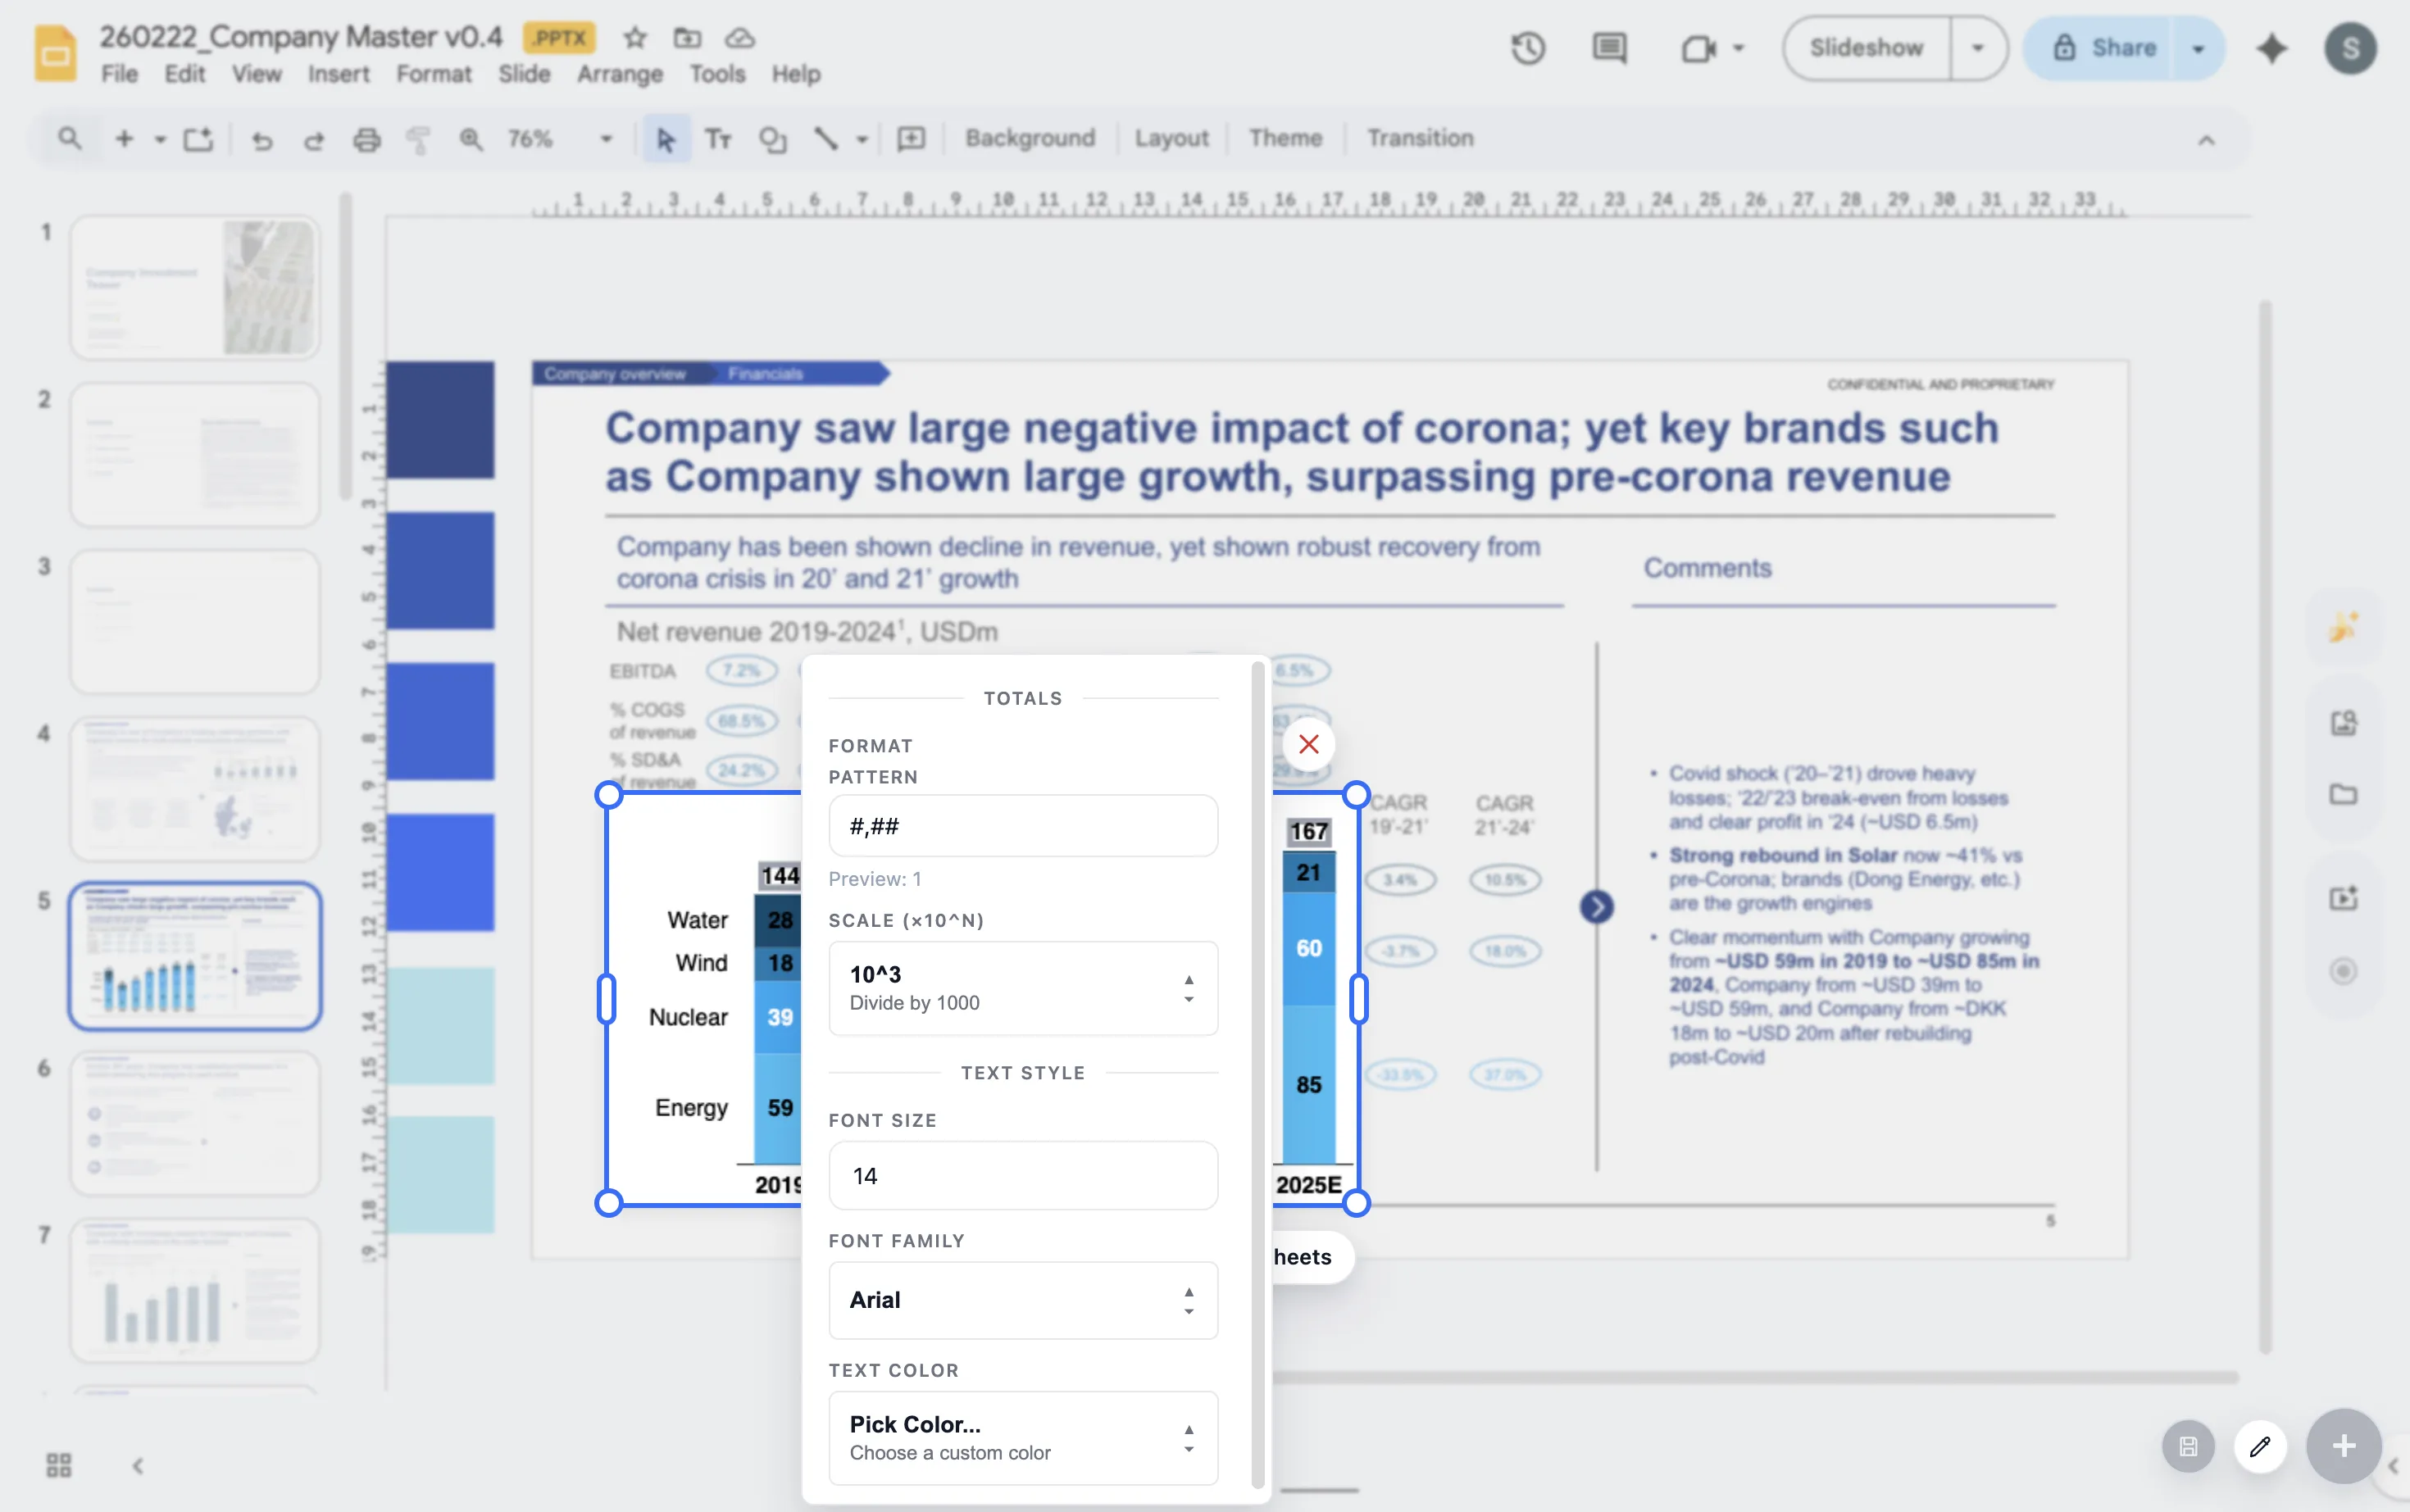
Select the business chart that fits the story, including stacked bars, 100% bars, line charts, and waterfall charts.
3. Add data and structure
Enter the categories and values, then adjust the series order so the chart reads naturally from left to right.
4. Shape the takeaway
Use labels, totals, deltas, dashed potential, and annotations to direct attention to the point that matters.
5. Keep it on-slide
Preview and place the chart in the deck where it belongs instead of exporting static screenshots back and forth.
6. Revisit later
When the numbers change, return to the chart and keep updating the same narrative asset instead of rebuilding it from zero.
What teams get
- Faster weekly updates for operating reviews and board materials
- Cleaner slides with charts that look designed for the deck rather than pasted into it
- A workflow that matches Google Workspace instead of forcing a PowerPoint detour
What this walkthrough proves
Install is not the hard part
The real value is what happens after install: how quickly a team can get from raw categories and series to a chart that reads clearly in the room.
Styling is part of the workflow
Presentation-ready output depends on spacing, totals, deltas, and labels, not just plotting data. The walkthrough covers those decisions.
Repeat updates matter
The point is not a one-off chart. The point is returning later when the numbers change and keeping the same story asset alive.
FAQ
Questions teams ask when they evaluate the workflow.
Do I need a spreadsheet export step for ChartKit?
No. The workflow is designed to avoid the screenshot-export-rebuild loop and keep the chart editing step close to the deck.
Can I revisit the same chart later?
Yes. That is one of the main reasons to use the workflow. Teams get the most value when they can reopen a chart, update the numbers, and keep the presentation logic intact.
Which related pages should I read next?
Read the product overview for the broader positioning, or jump to the waterfall and stacked bar guides if you are trying to map a specific chart type to the workflow.