Product fit
ChartKit for Google Slides
ChartKit is a Google Workspace-native charting workflow for teams that need presentation-ready charts inside Google Slides, Docs, and Sheets. It is built for people who update decks repeatedly and want the chart to stay close to the slide instead of living in a spreadsheet export chain.
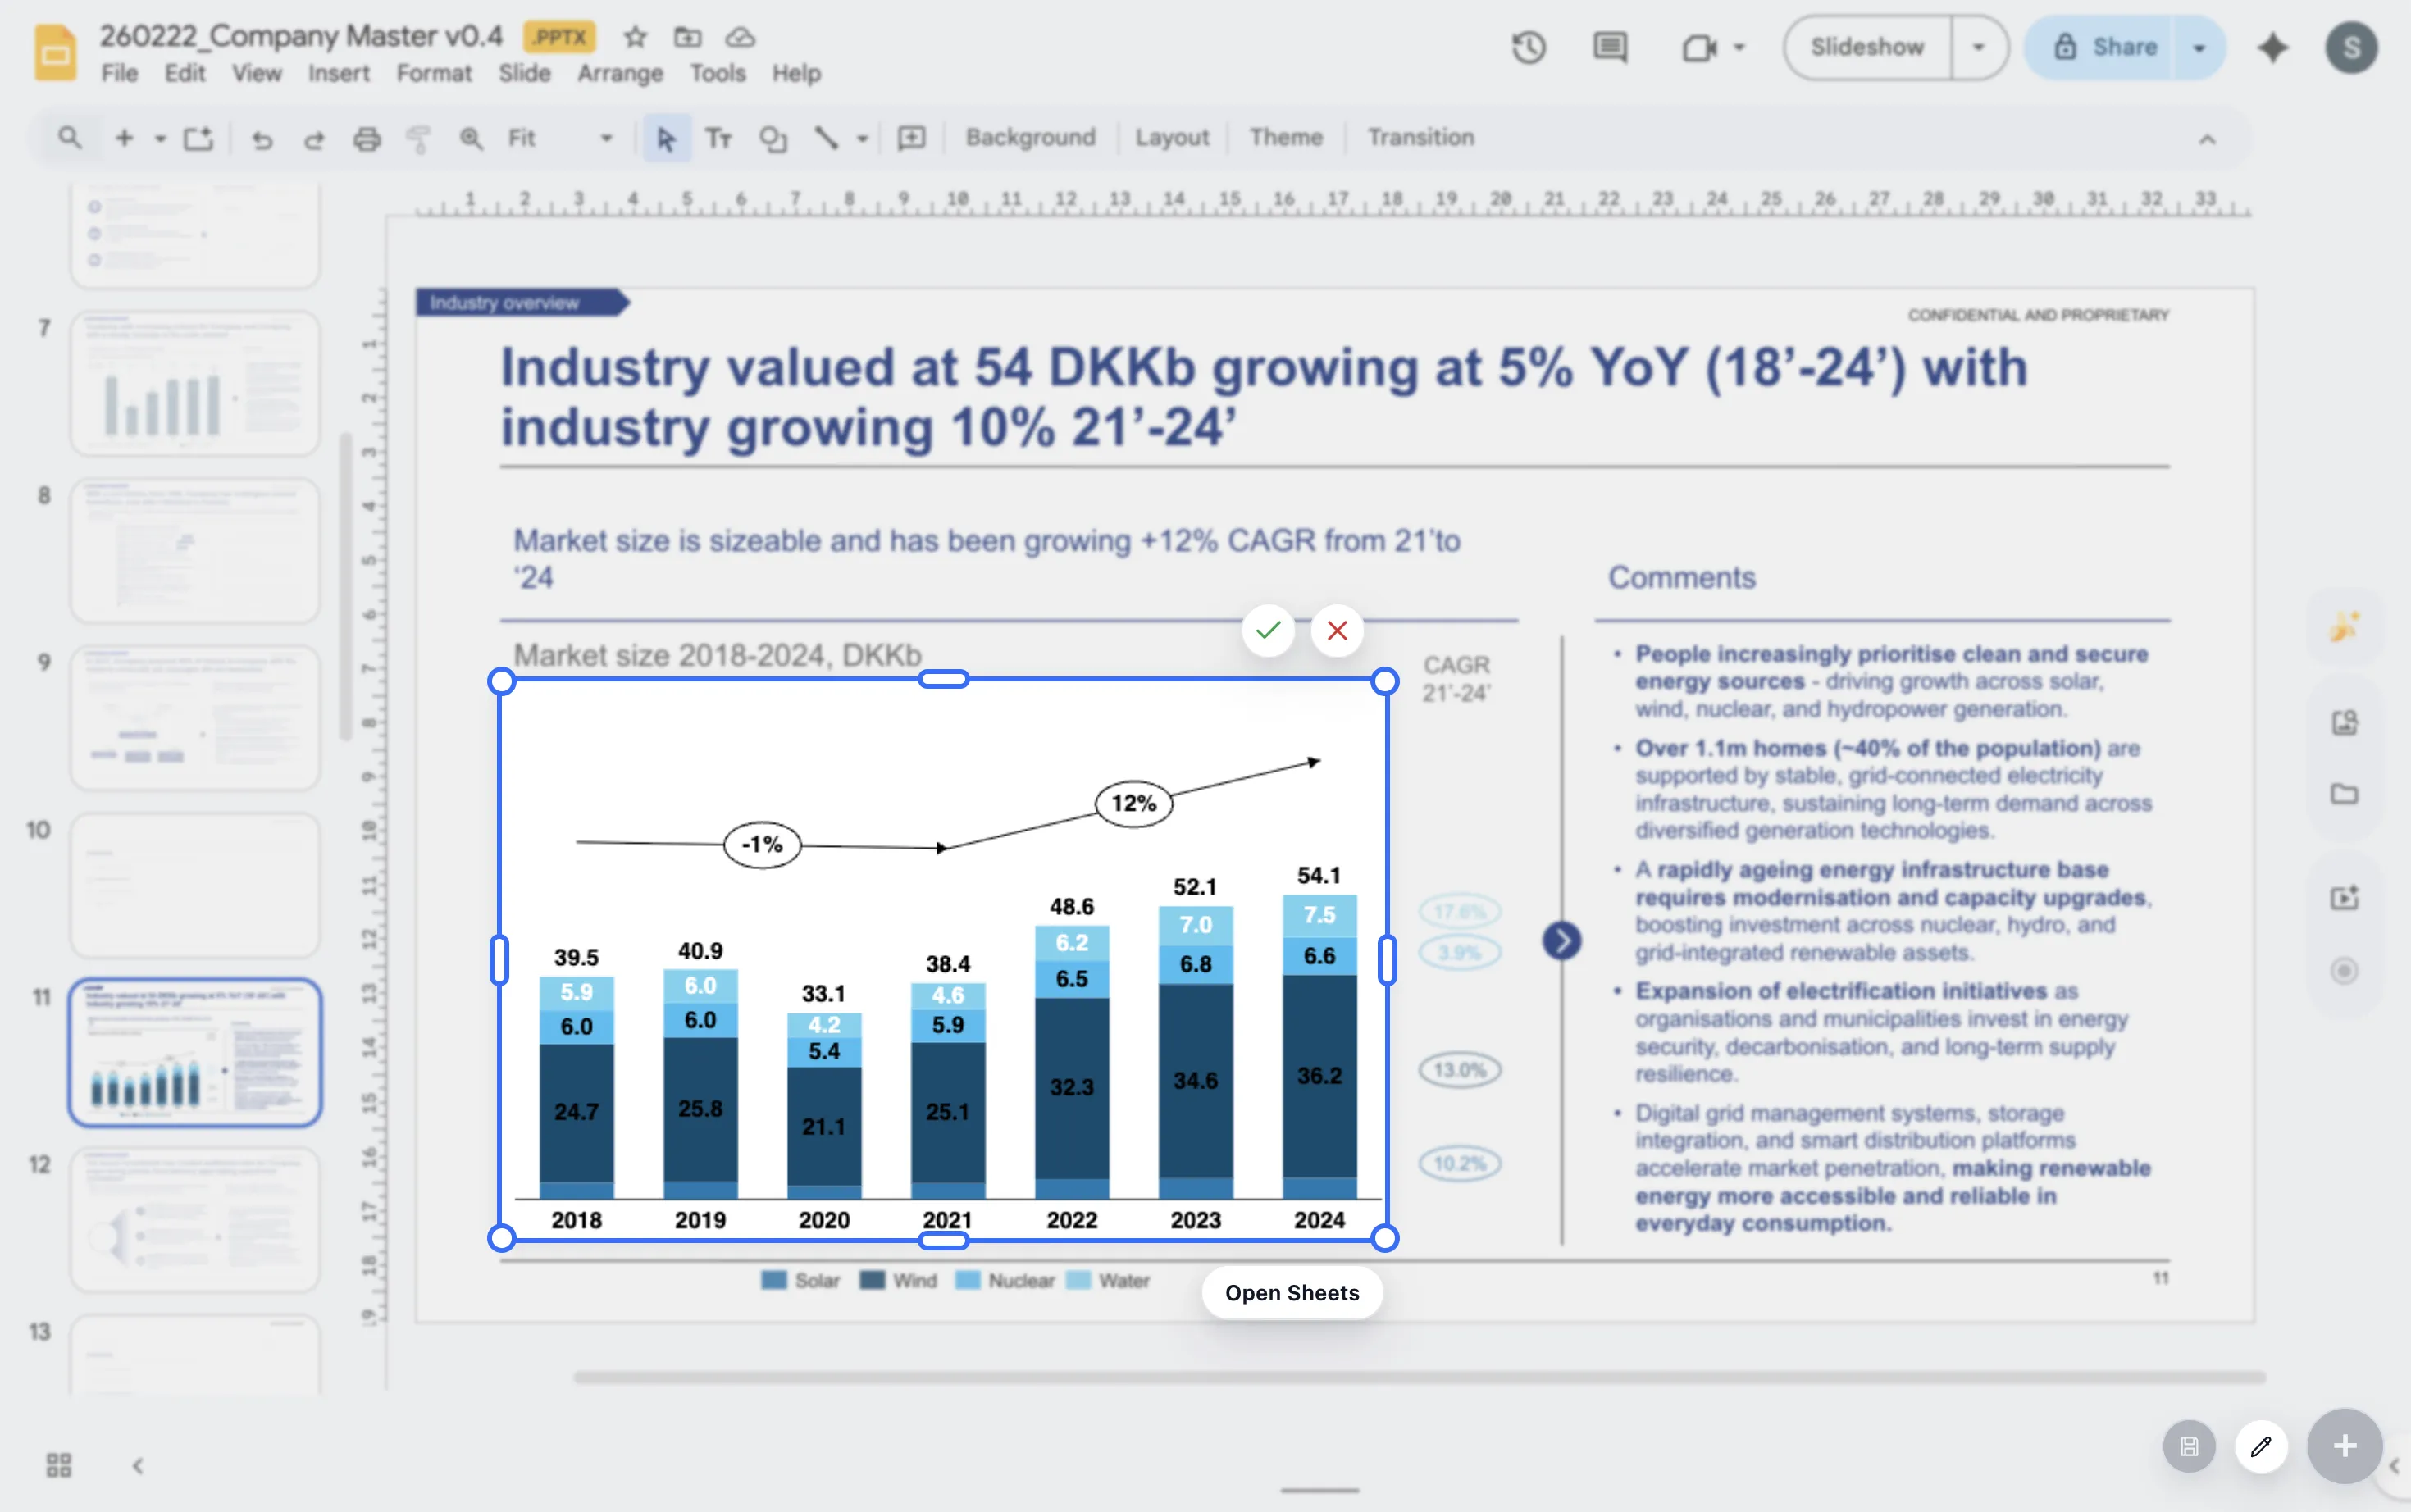
Chart types teams use weekly
Build stacked bars, 100% bars, line charts, and waterfall charts without leaving Google Workspace.
Storytelling controls
Use totals, deltas, dashed potential, labels, and annotations to make the takeaway easier to read on the first pass.
Presentation workflow
Insert on-slide, preview in context, and keep updating the chart as the narrative changes.
Why teams search for this
The real requirement is a Google Workspace charting workflow, not just a chart tool.
Closer to the slide
Teams usually want to avoid exporting a spreadsheet chart and rebuilding styling in the deck. ChartKit keeps the chart near the presentation context.
Repeatable weekly updates
The value is strongest when the same chart is updated again and again for operating reviews, board packs, and client updates.
Consultant-style communication
Storytelling helpers like totals, deltas, labels, and annotations matter because the chart has to explain a point quickly on a slide.
Who it is for
Best fit for teams that live in Google Workspace.
- Consultants building charts for weekly updates, steering committees, and board packs
- Finance and operations teams translating raw numbers into a clear narrative
- Founders and operators who want cleaner charts in Google Slides without switching tools
Workflow
How ChartKit fits into the slide-building process.
1. Install and open
Install the Chrome extension, open a deck, and launch ChartKit directly in the working presentation.
2. Build the chart
Add the series, categories, labels, and storytelling helpers you need for the point you are making.
3. Style for the audience
Adjust spacing, colors, totals, deltas, and labels until the chart reads cleanly in the room.
4. Update without rebuilding
Return to the chart later and keep the same chart logic close to the deck instead of starting from scratch.
FAQ
Common questions about ChartKit for Google Slides.
Is ChartKit only for Google Slides?
Google Slides is the core use case, but the workflow is built for Google Workspace, including Docs and Sheets, so teams can keep chart logic close to the file they are already editing.
Which teams get the most value from ChartKit?
Consultants, finance teams, founders, and operators benefit most when they are updating presentation-ready charts every week instead of creating one-off visuals.
What should I read next if I am evaluating the workflow?
Start with the walkthrough if you want the end-to-end product flow, or read the Think-cell comparison if you are deciding between a PowerPoint-style workflow and a Google Workspace-native one.