
Blog
Practical guides on charts, decks, and the workflow.
For consultants, FP&A teams, and operators building management-ready decks in Google Workspace.
AllProductComparisonTutorialGuide

ProductSeptember 2026
How to Make Charts in Claude and ChatGPT for Google Slides
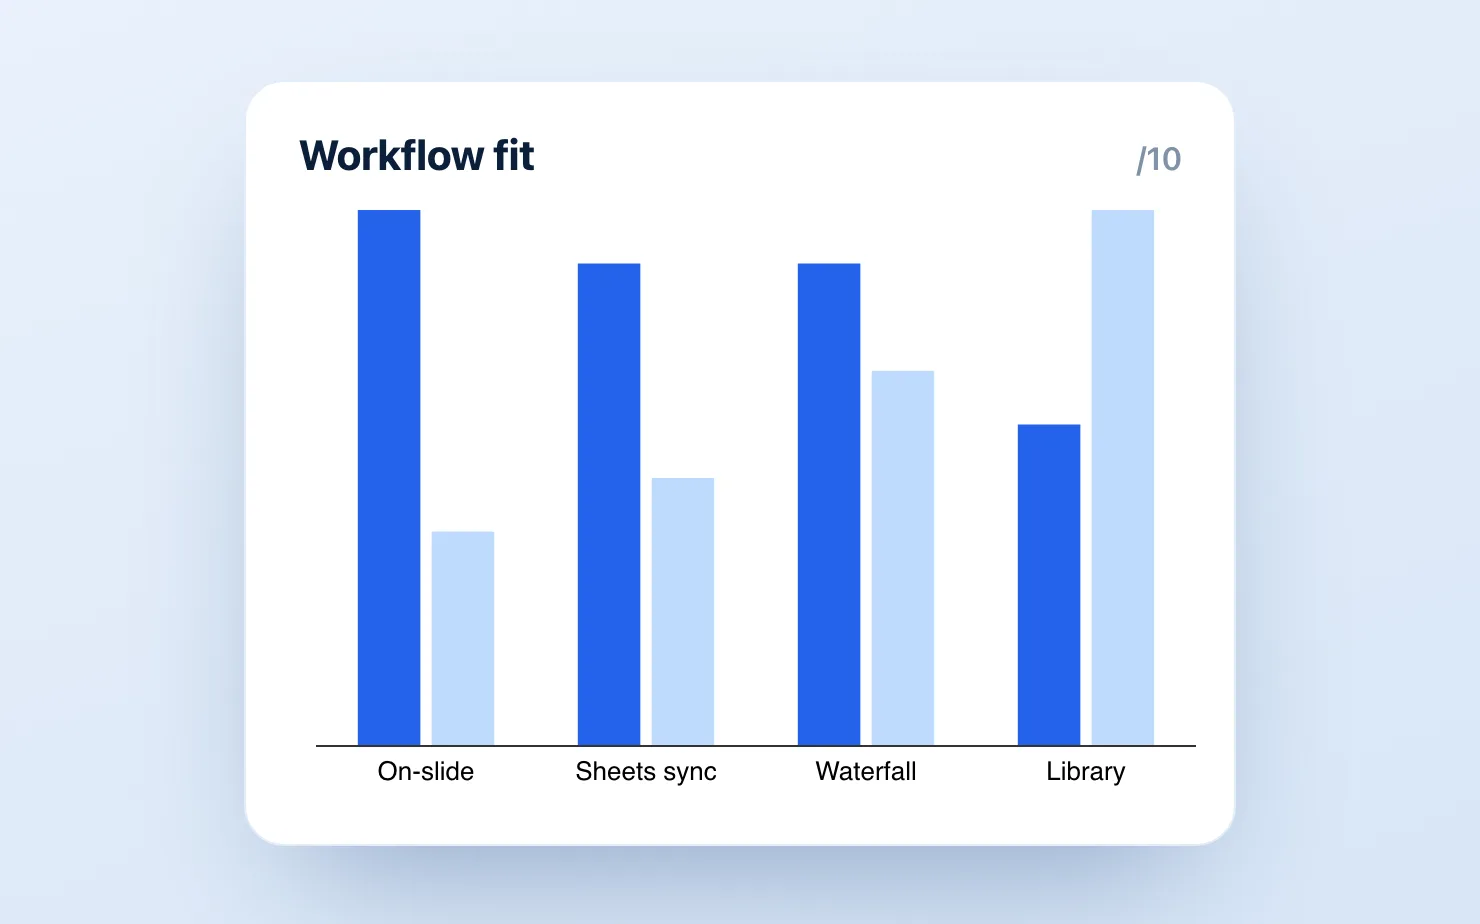
ComparisonAugust 2026
ChartKit vs Vizzlo for Google Slides (2026)
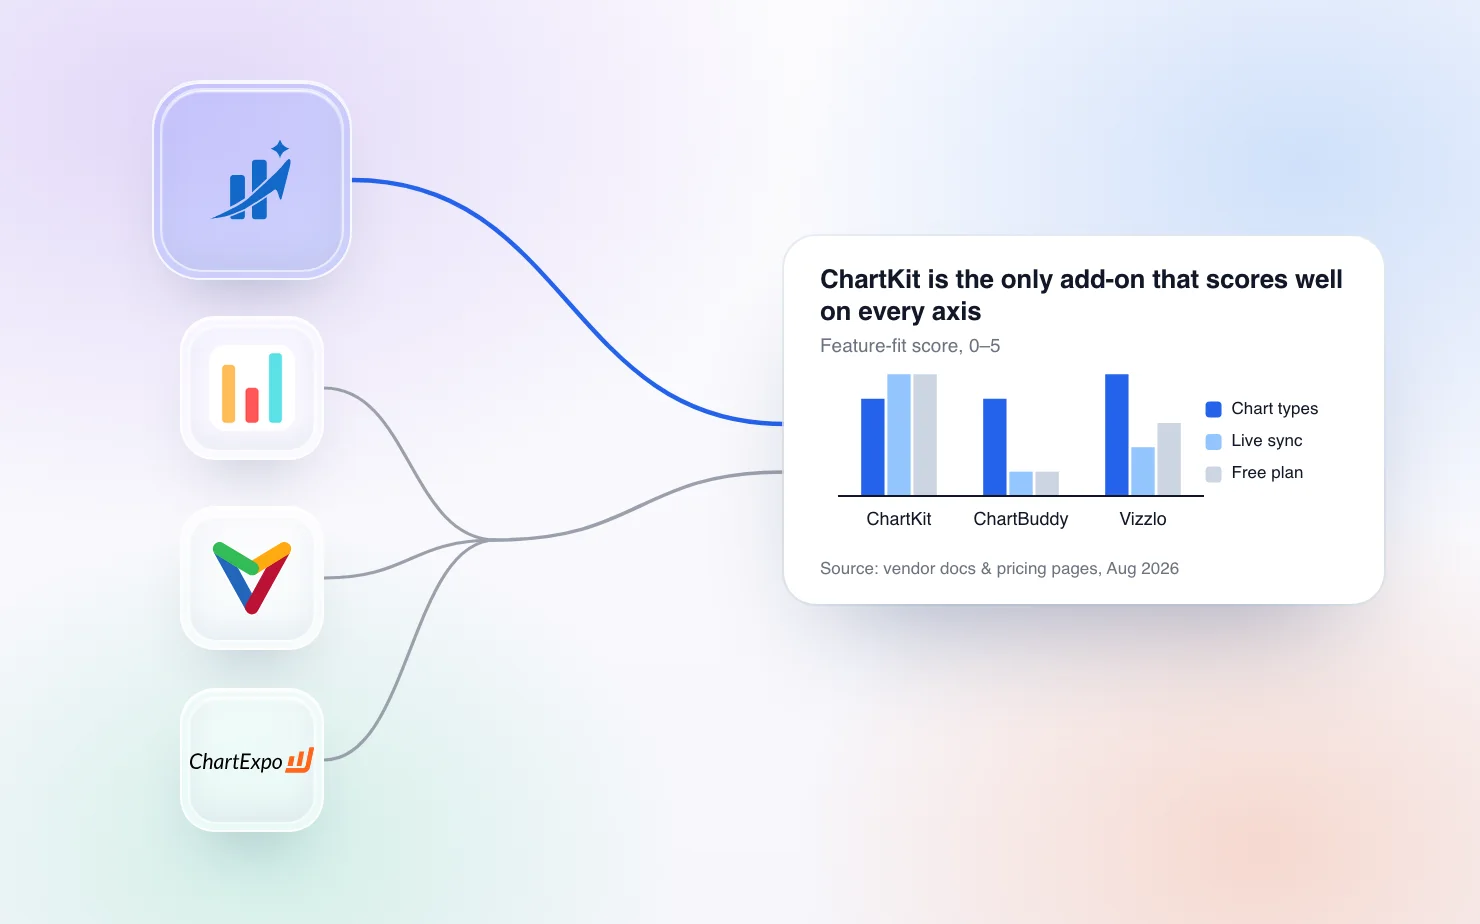
ComparisonAugust 2026
Best Google Slides chart add-ons, compared (2026)
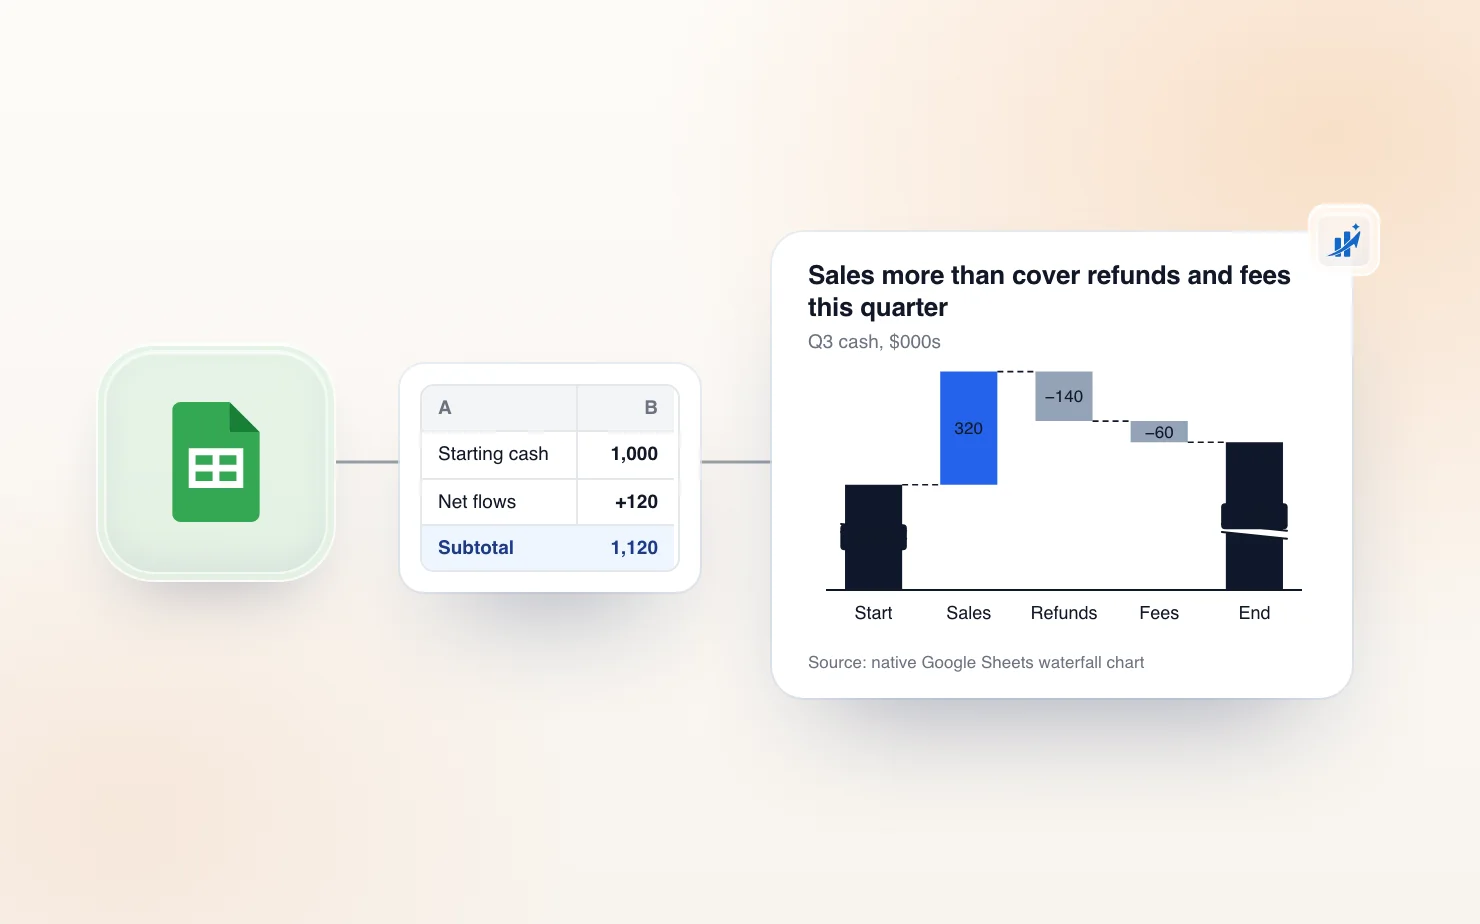
TutorialAugust 2026
How to make a waterfall chart in Google Sheets
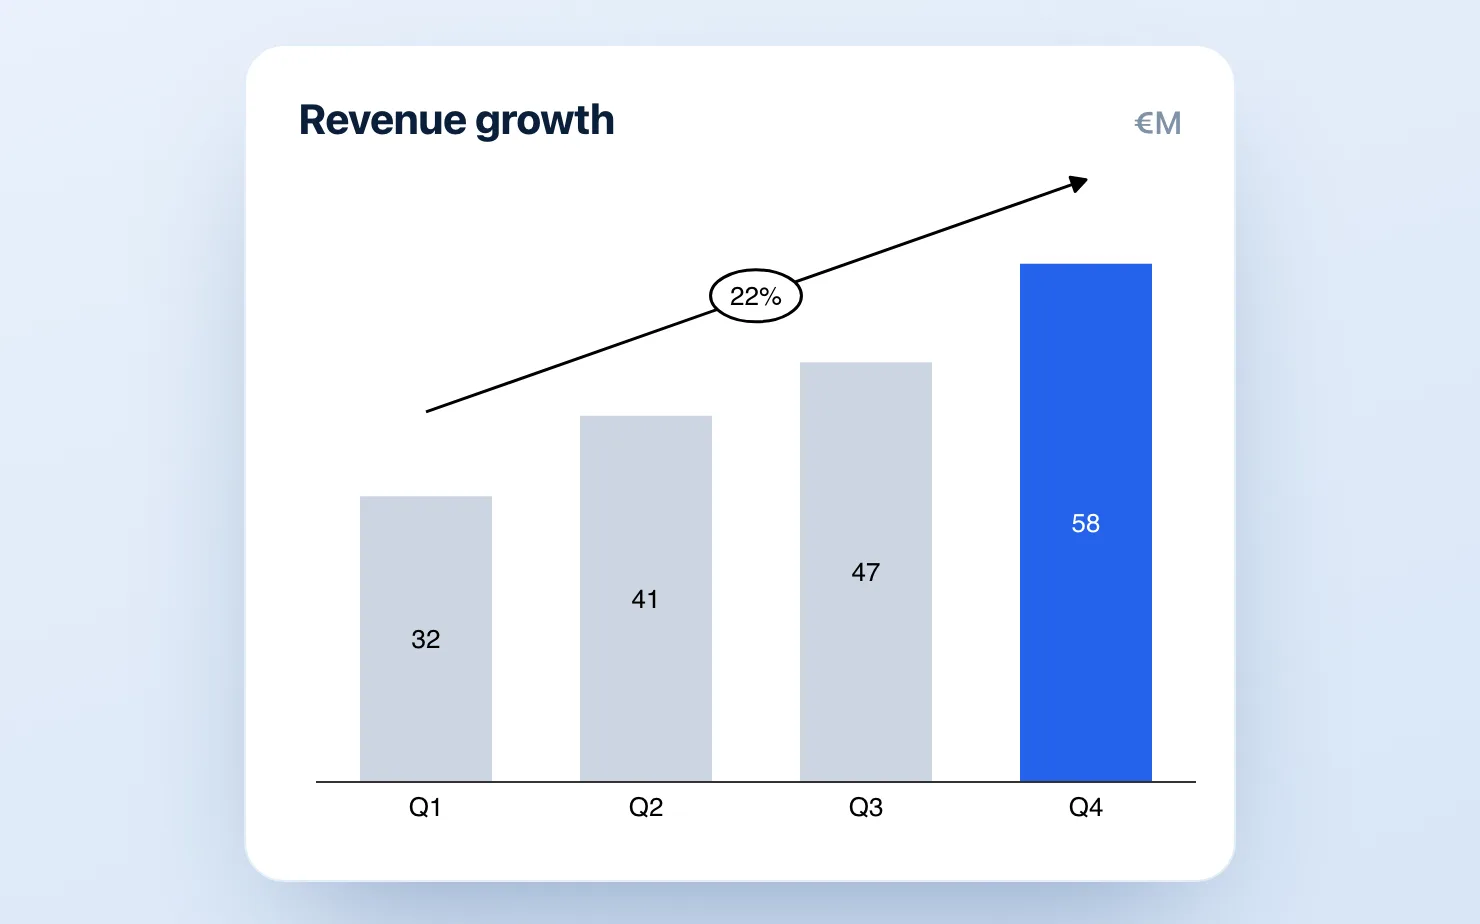
TutorialJuly 2026
How to make McKinsey-style charts in Google Slides
TutorialJuly 2026
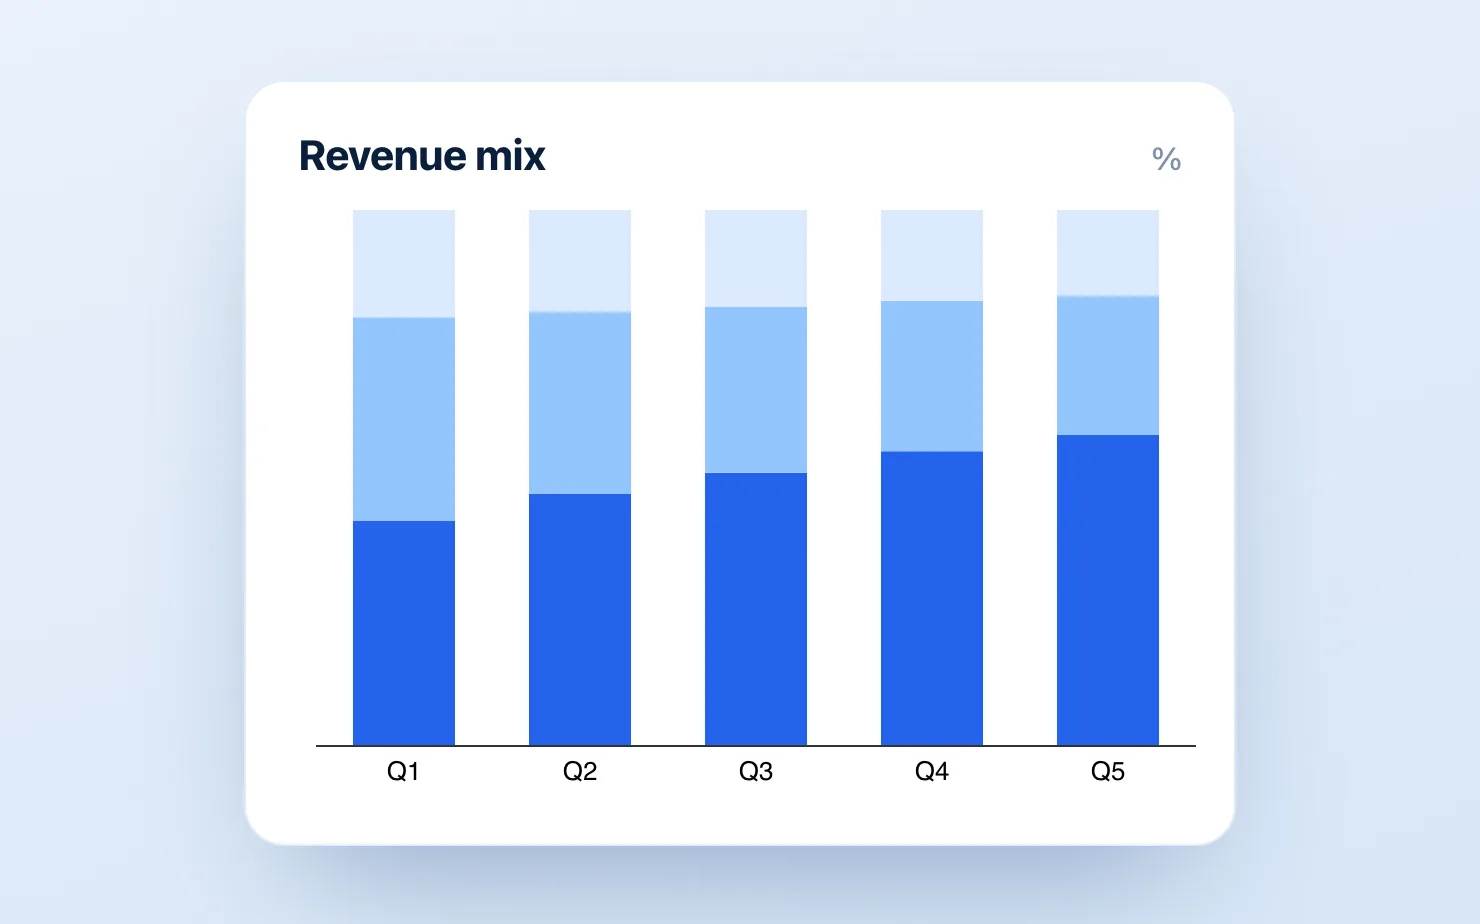
How to Make a 100% Stacked Bar Chart in Google Slides
TutorialJuly 2026
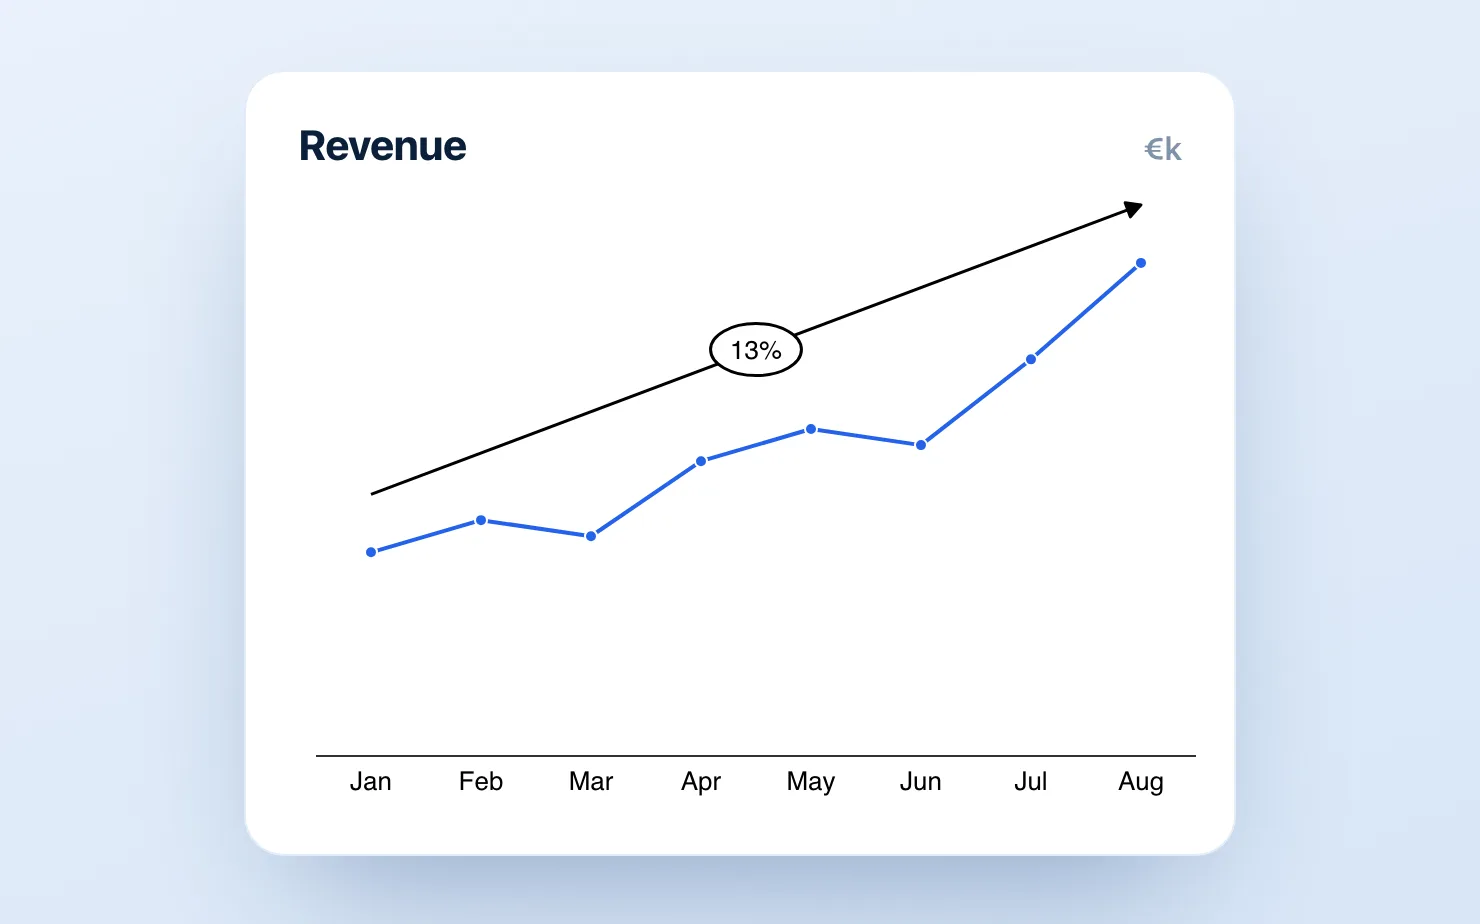
How to create charts in Google Slides (2026 guide)
ComparisonJuly 2026
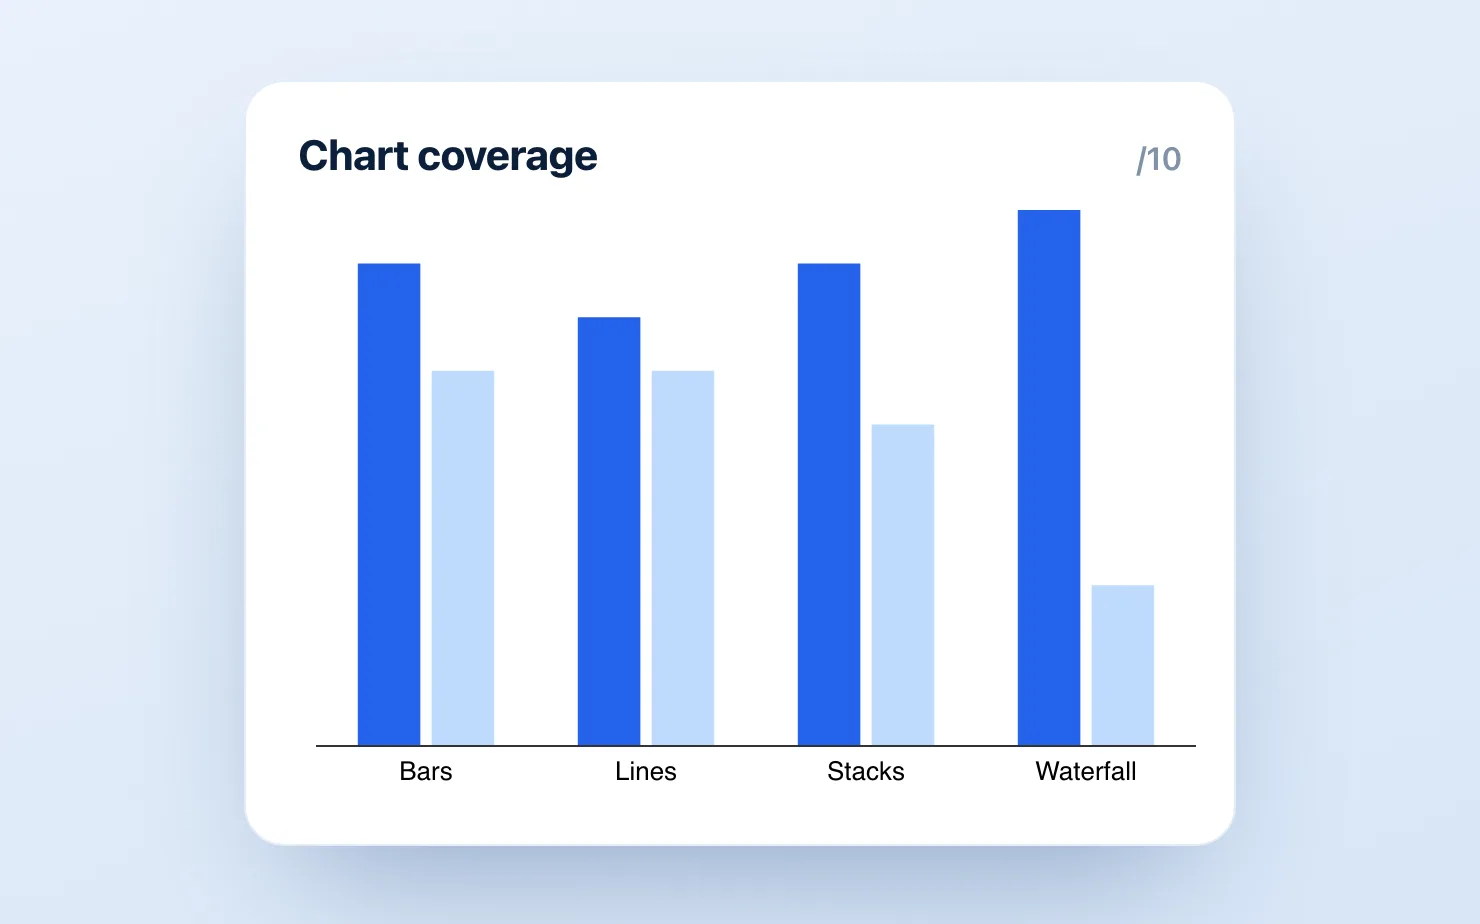
ChartKit vs ChartBuddy for Google Slides (2026)
TutorialJuly 2026
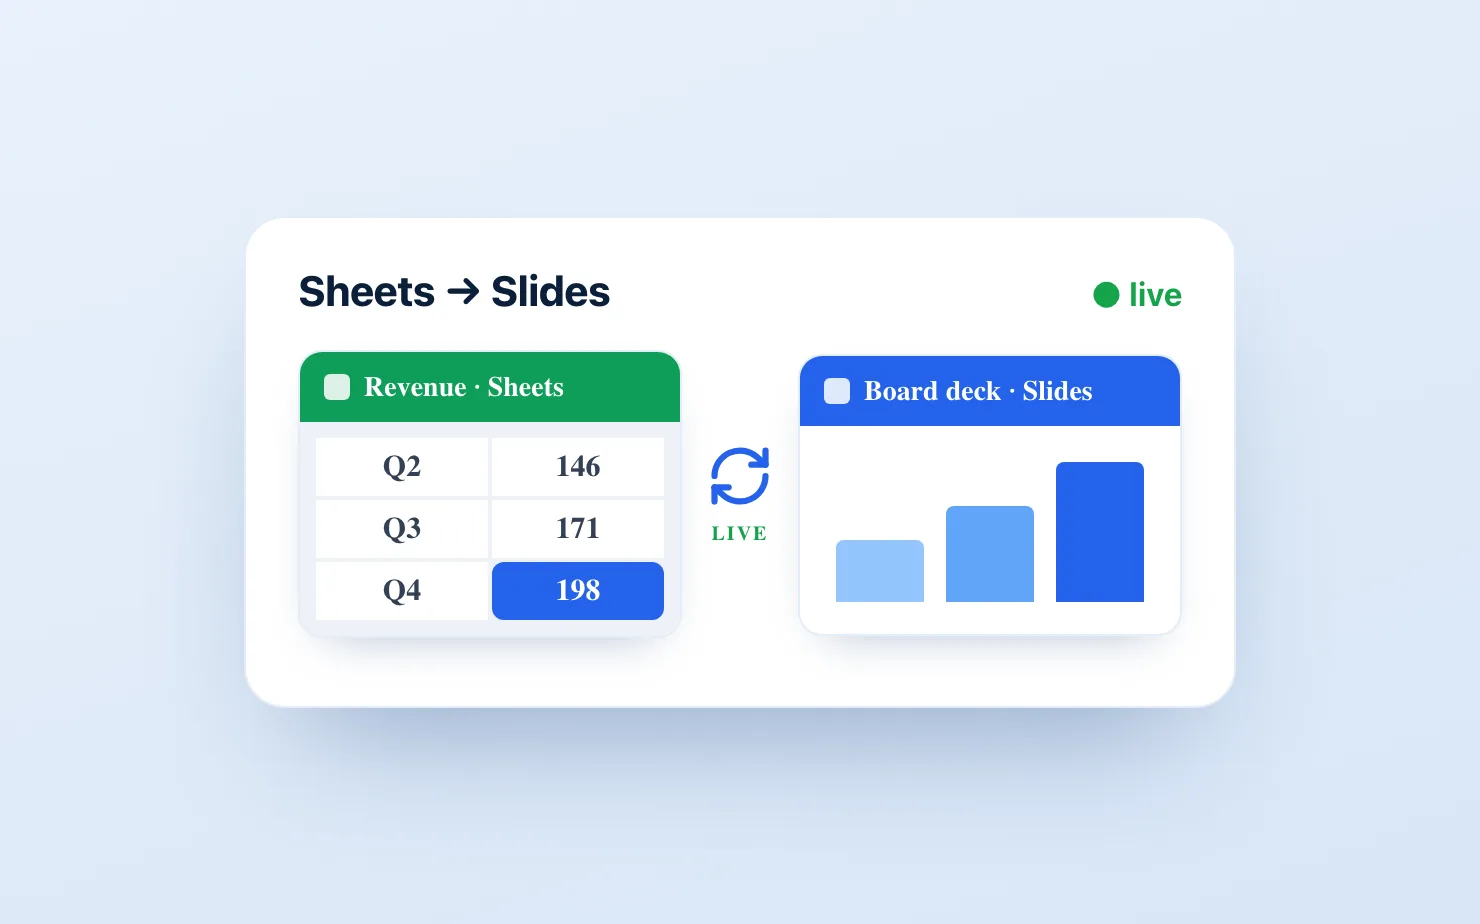
How to make Google Slides charts update automatically from Google Sheets
ProductJuly 2026
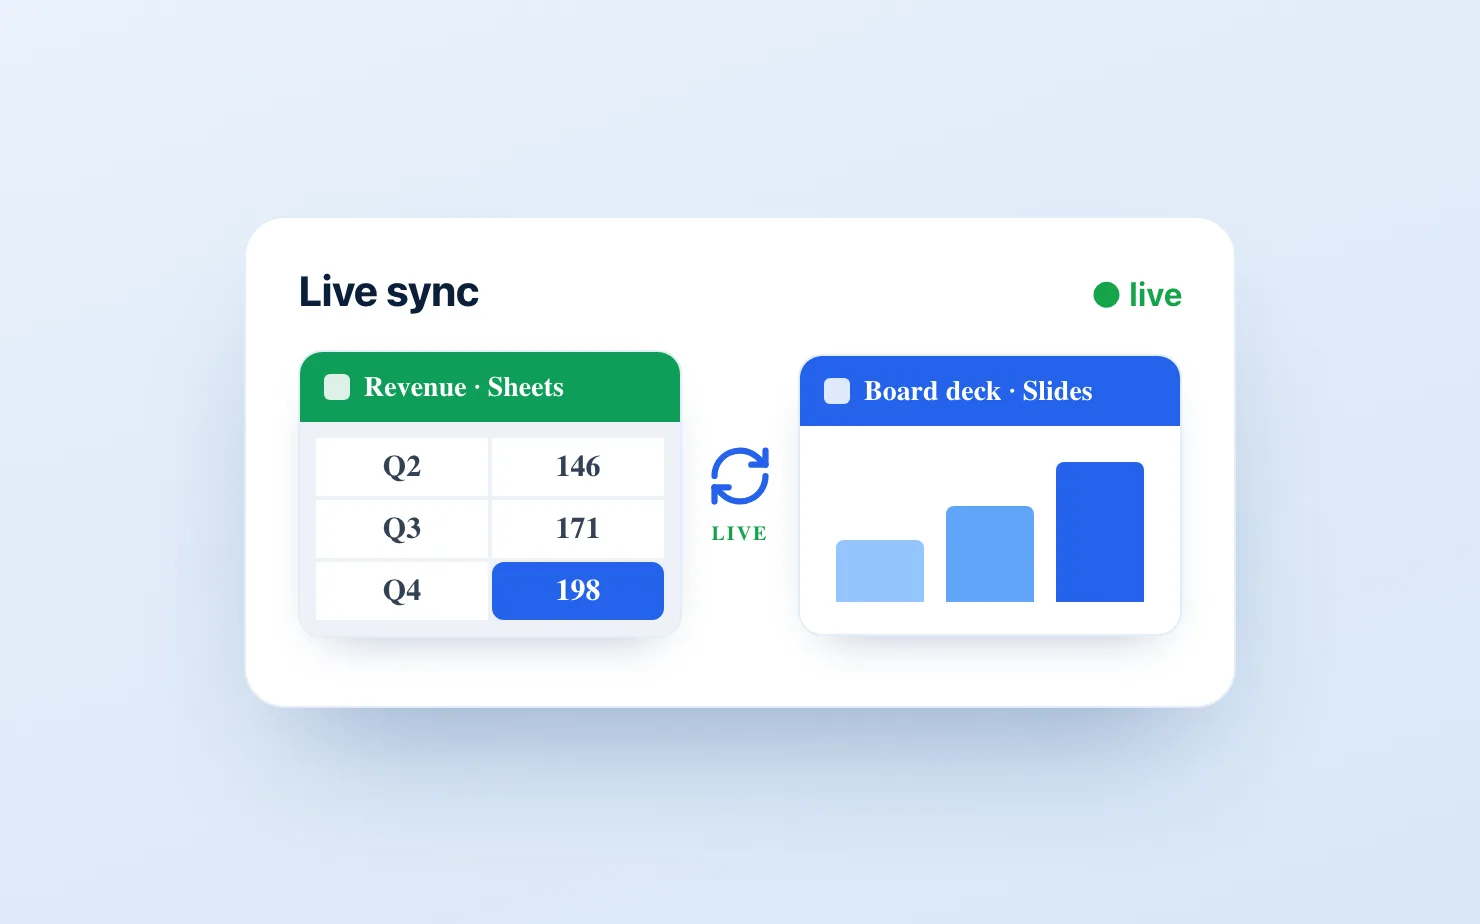
New in ChartKit: your Slides charts now live-sync with Google Sheets
TutorialJuly 2026
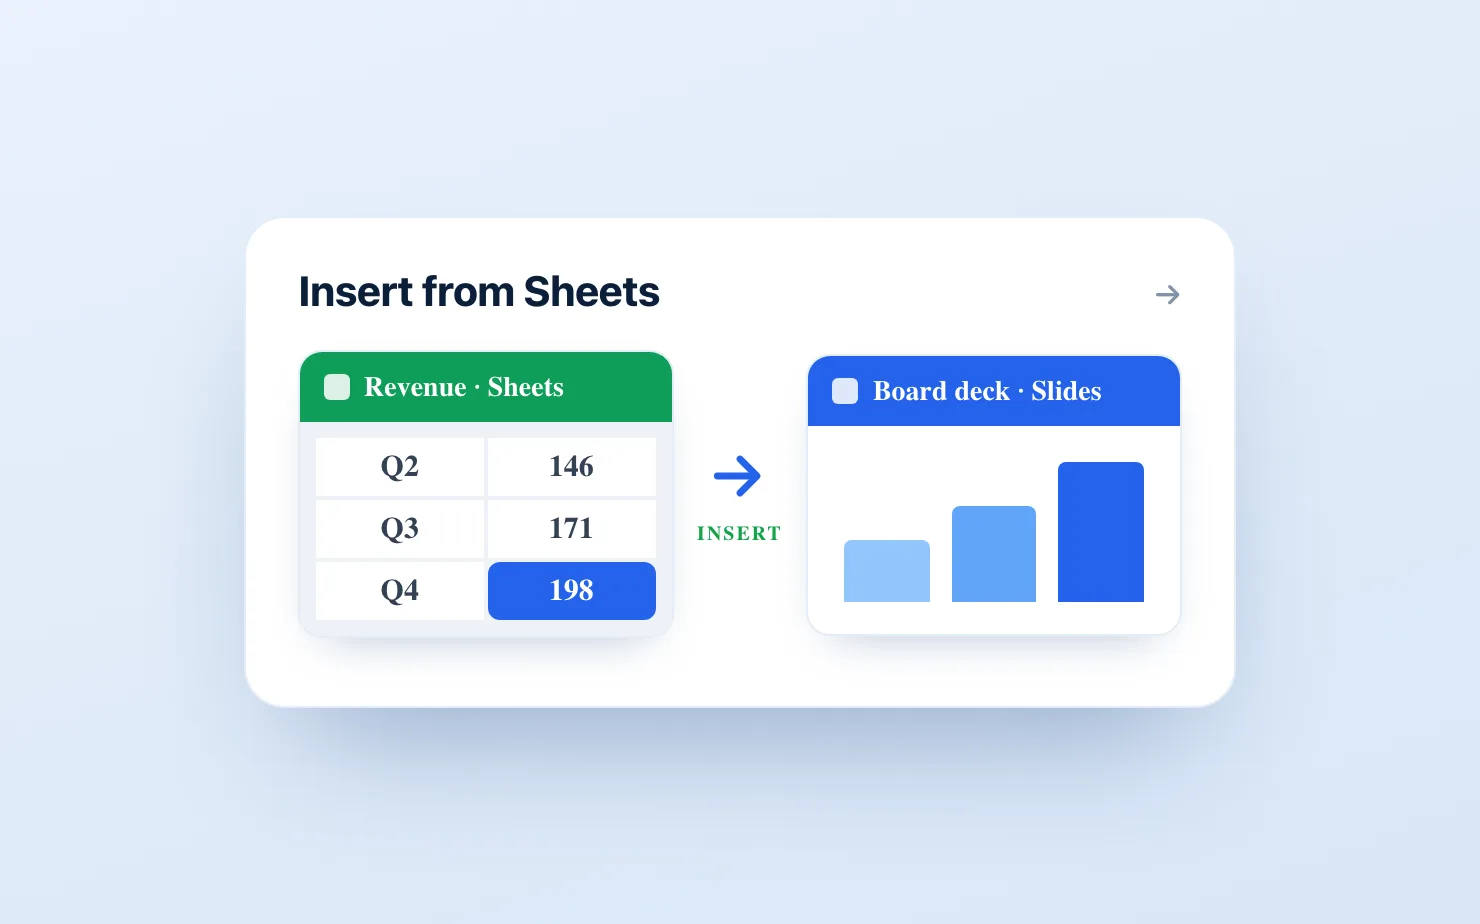
How to insert a Google Sheets chart into Google Slides (2026)
ComparisonJuly 2026
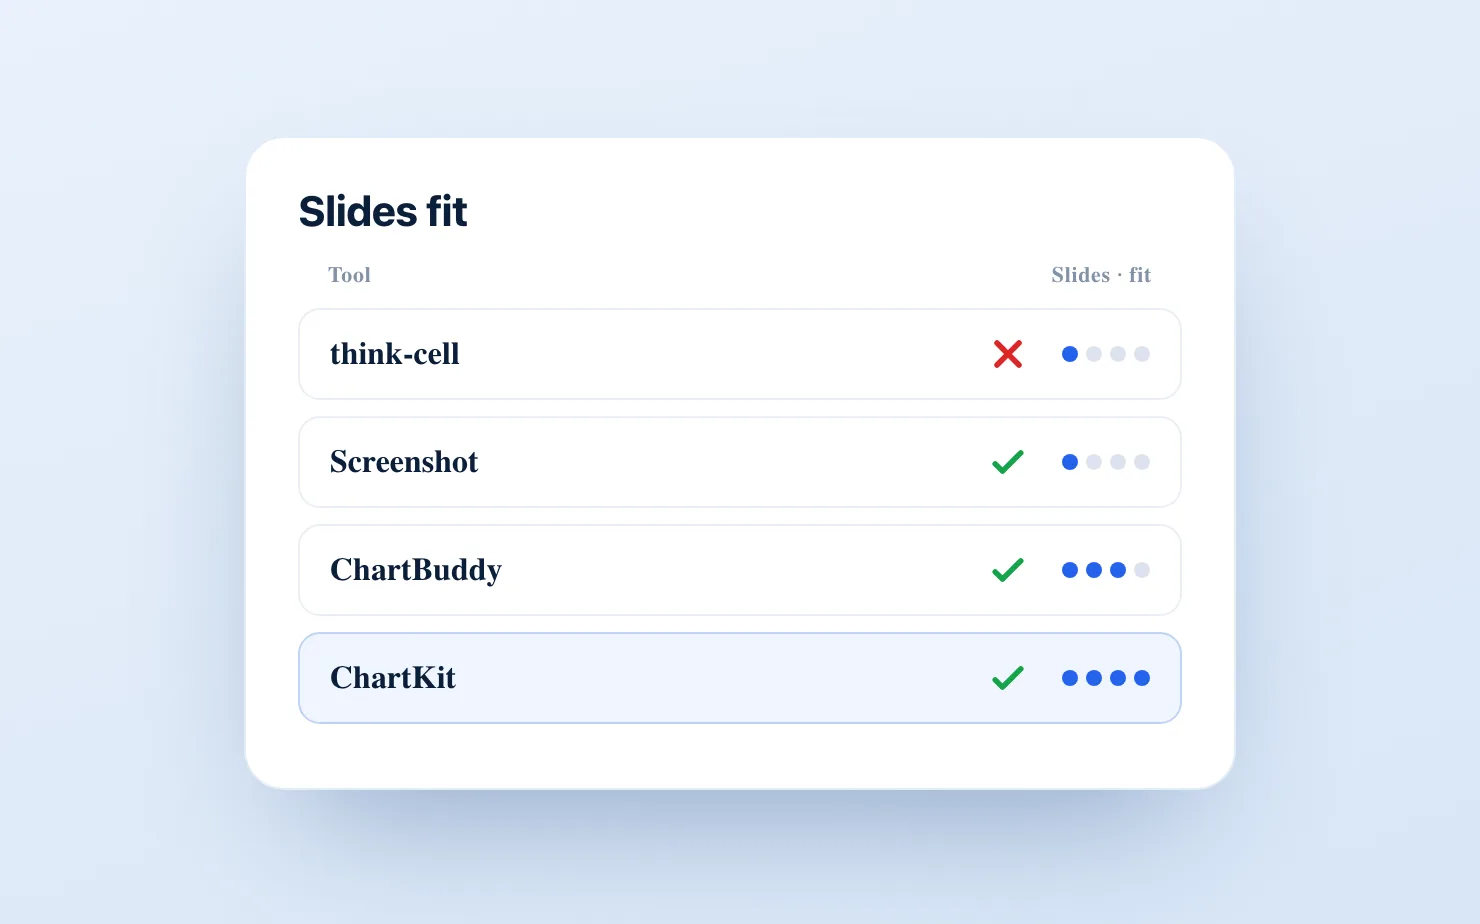
The 4 real think-cell alternatives for Google Slides
TutorialJune 2026
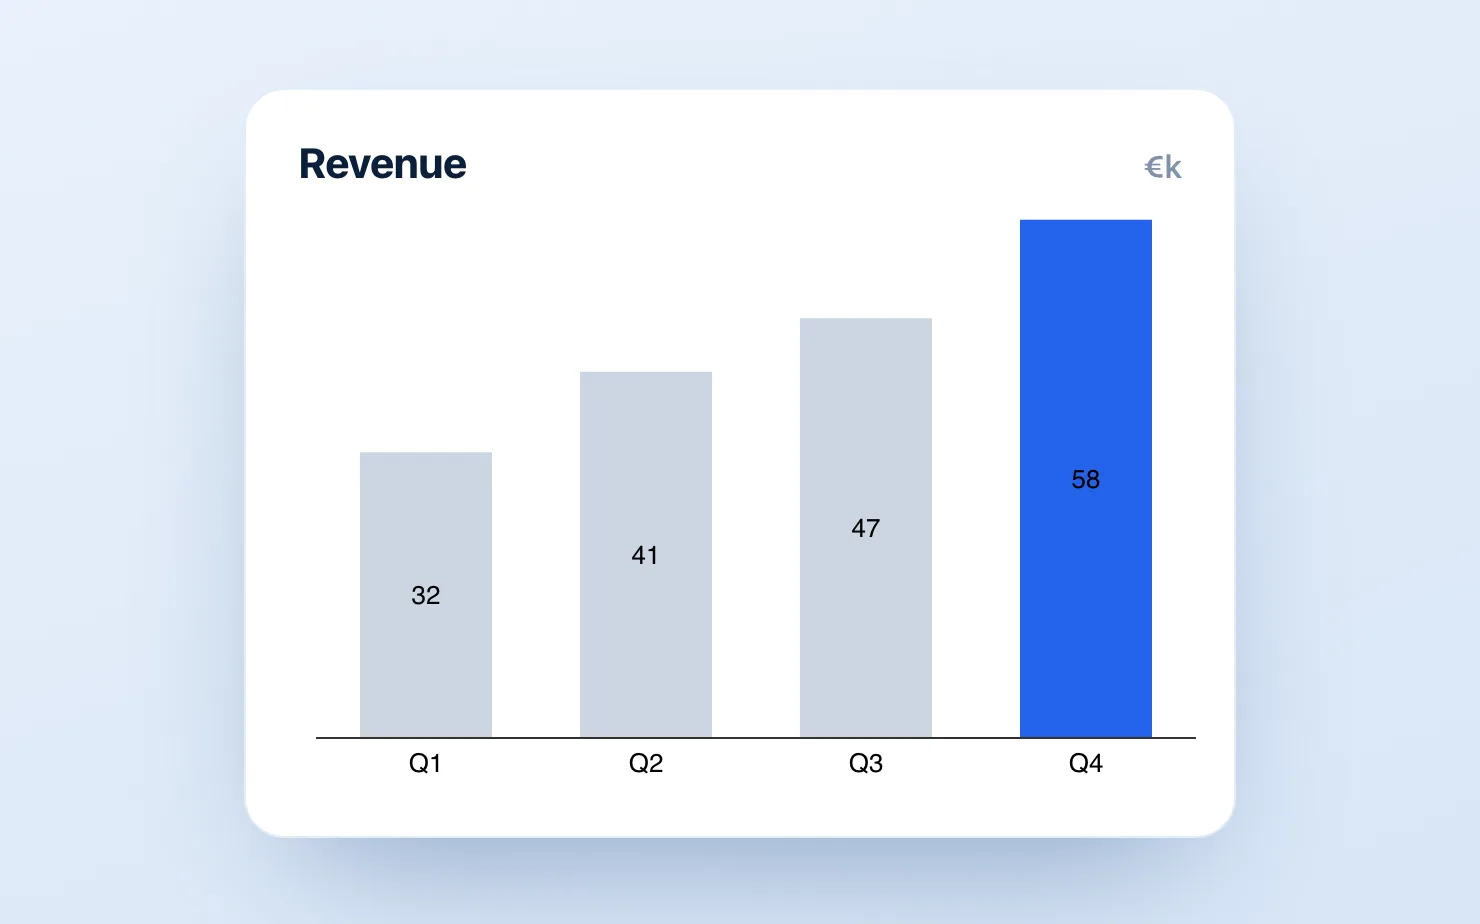
How to add data labels to a chart in Google Slides
TutorialJune 2026
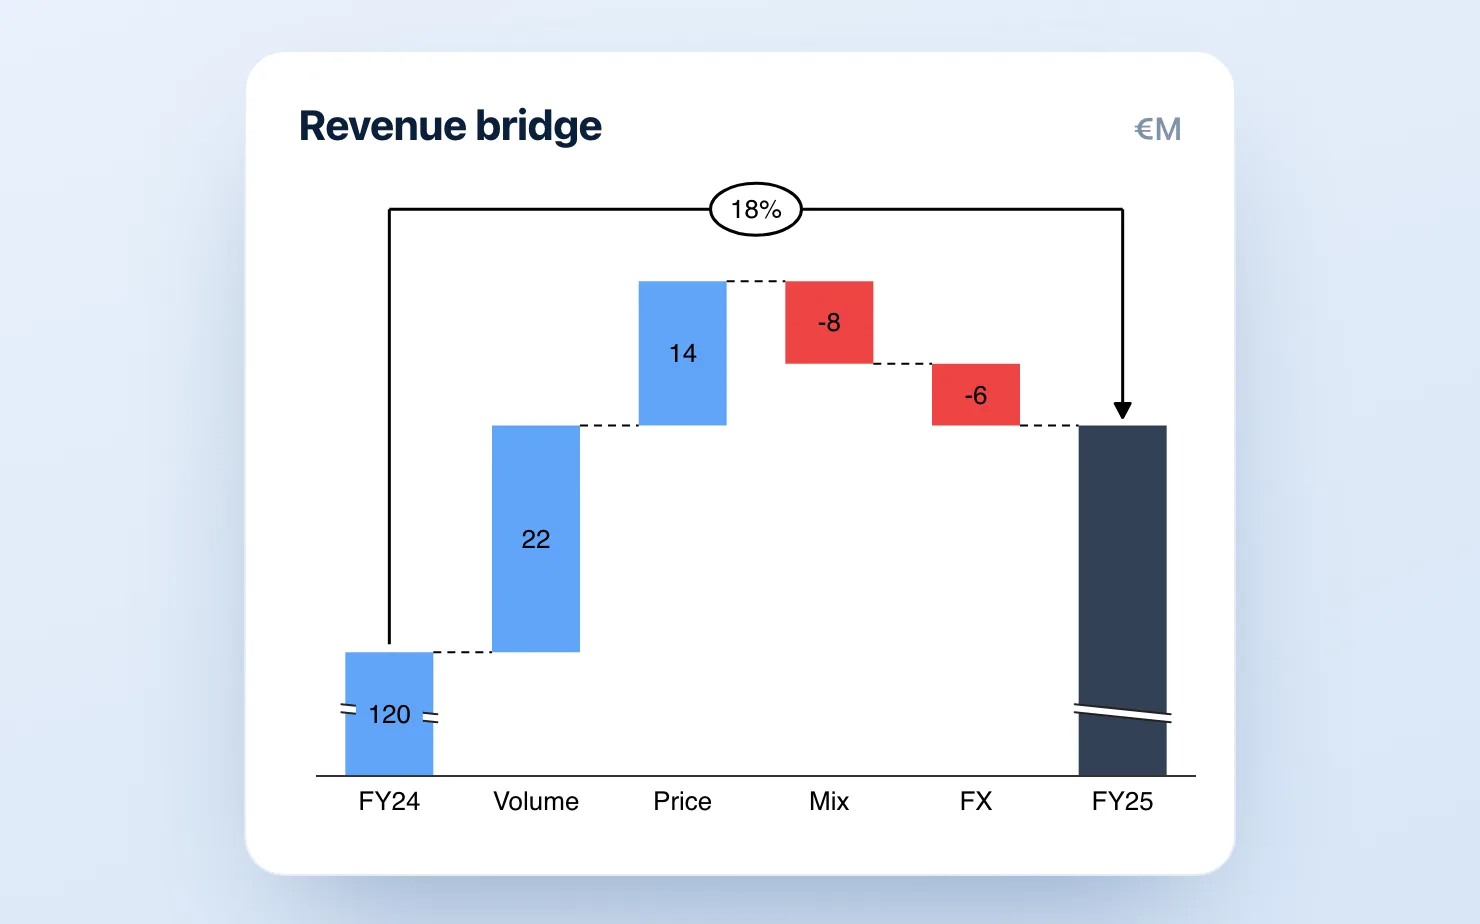
How to make a bridge chart in Google Slides
TutorialJune 2026
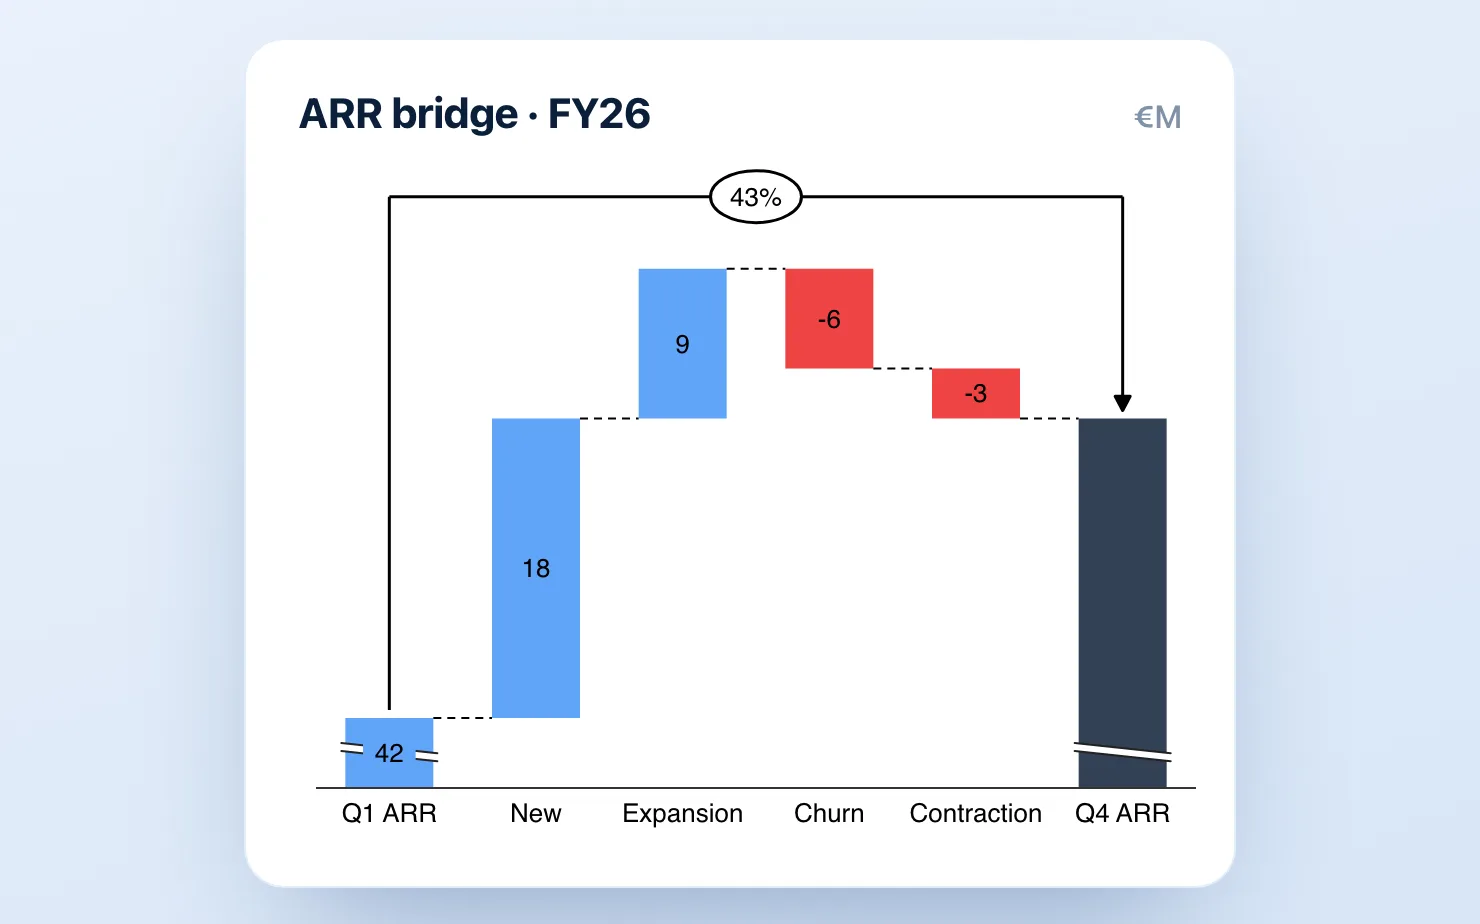
How to make a waterfall chart in Google Slides
ComparisonJune 2026
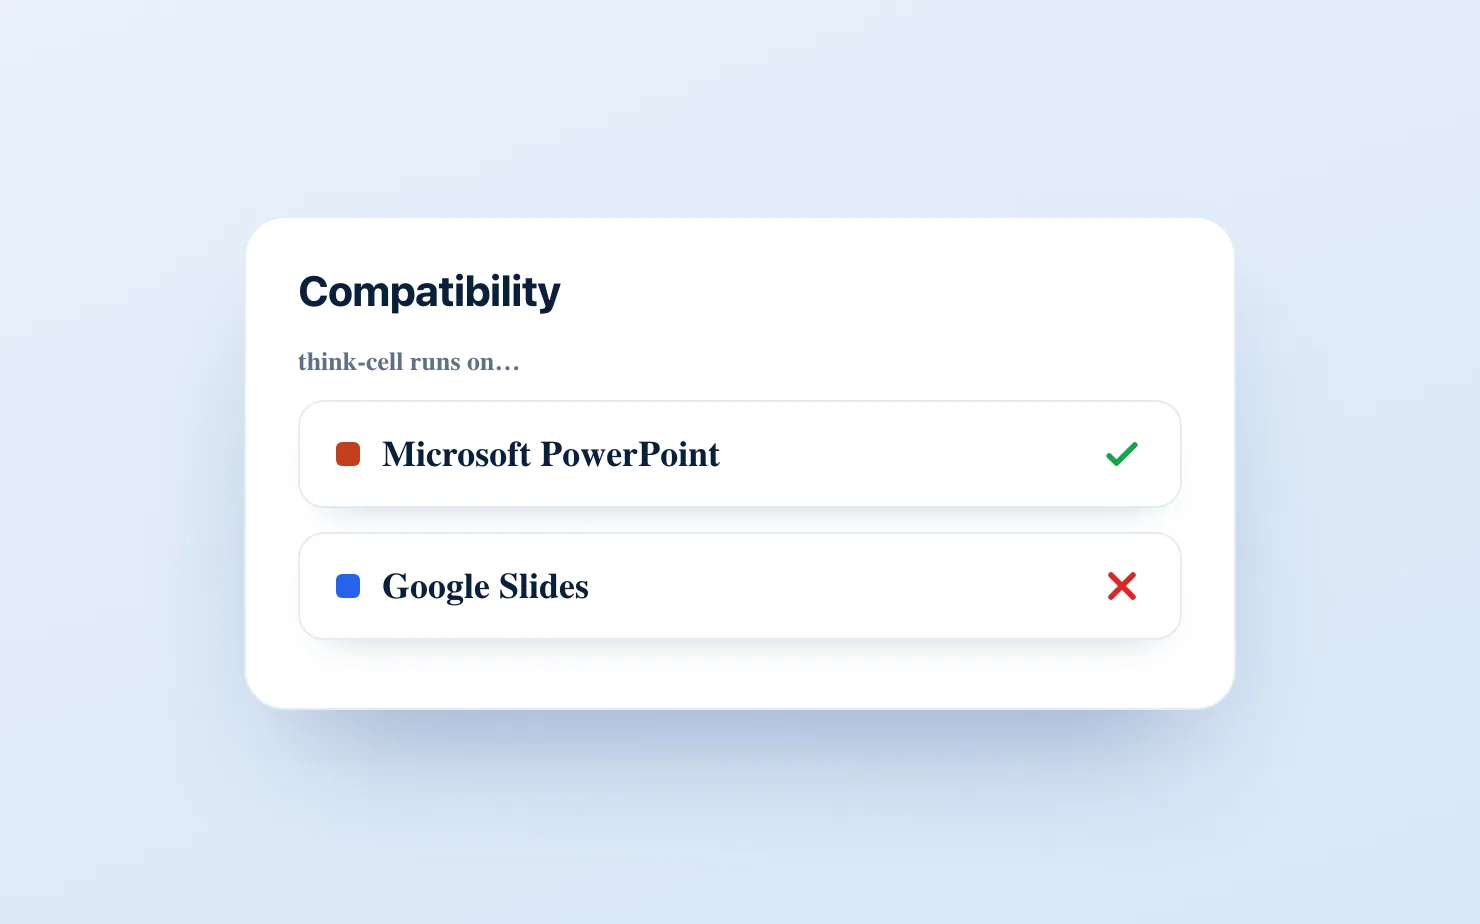
Why think-cell doesn't work in Google Slides
GuideJune 2026
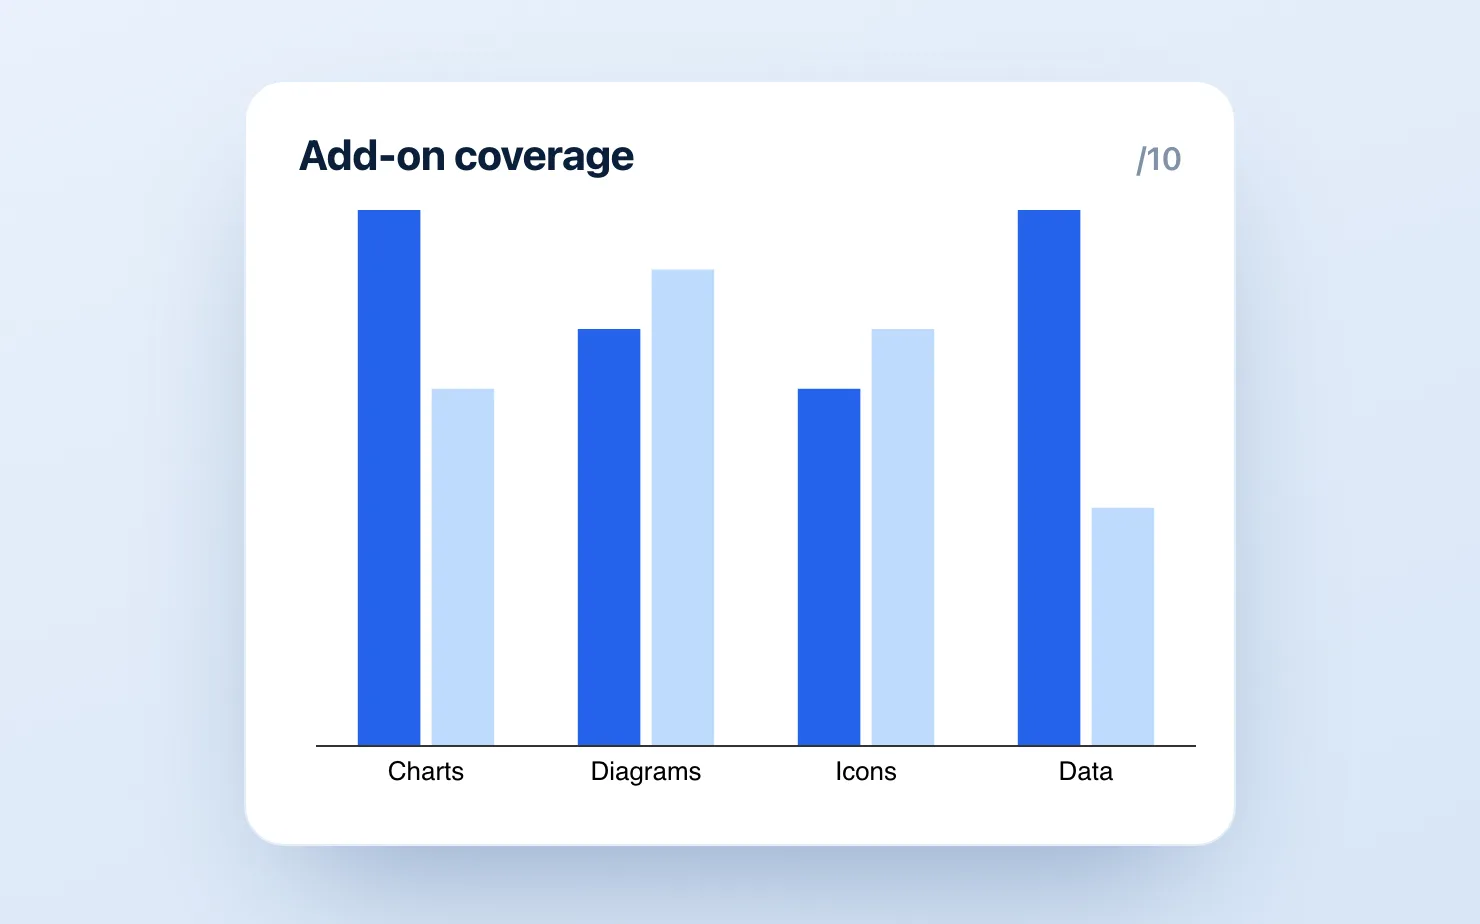
The 8 Google Slides add-ons consultants actually use
GuideJune 2026
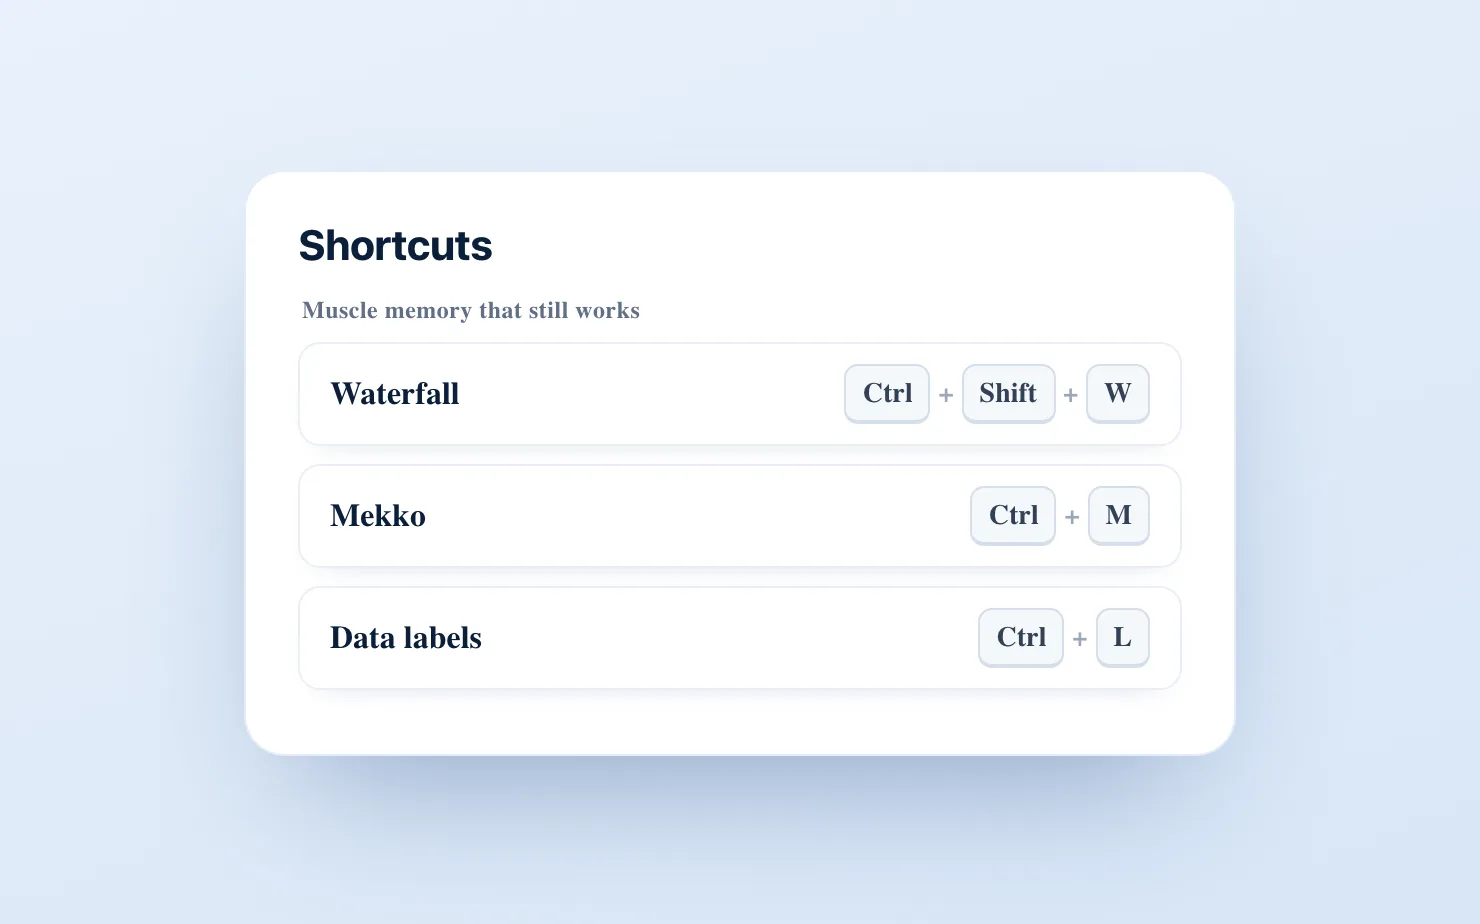
The ex-consultant's guide to surviving Google Slides after think-cell
GuideMay 2026
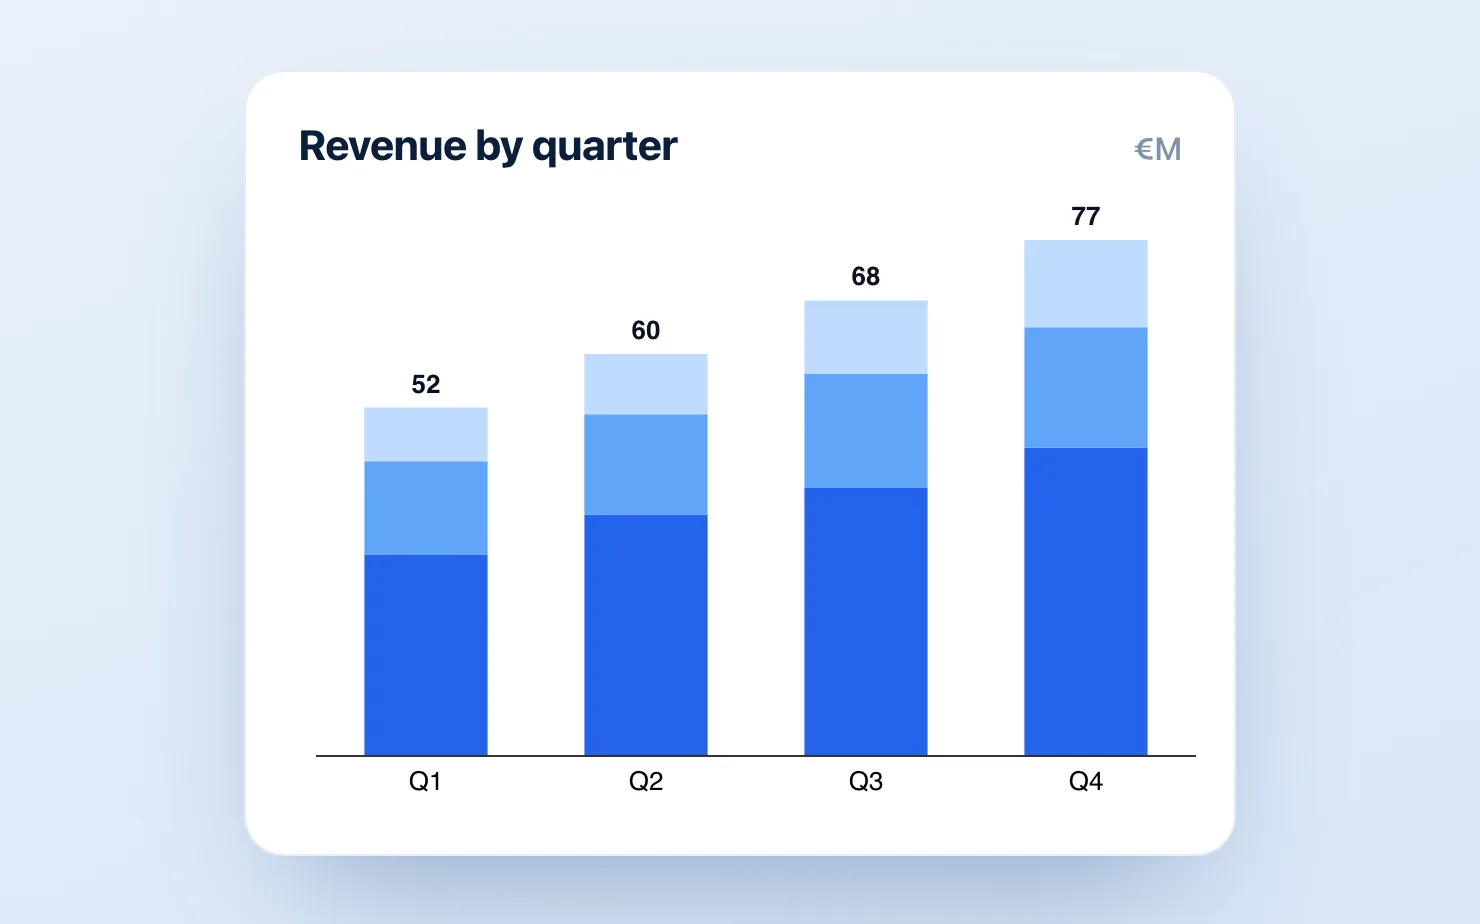
Building board-ready charts in Google Slides: an FP&A playbook
TutorialMay 2026
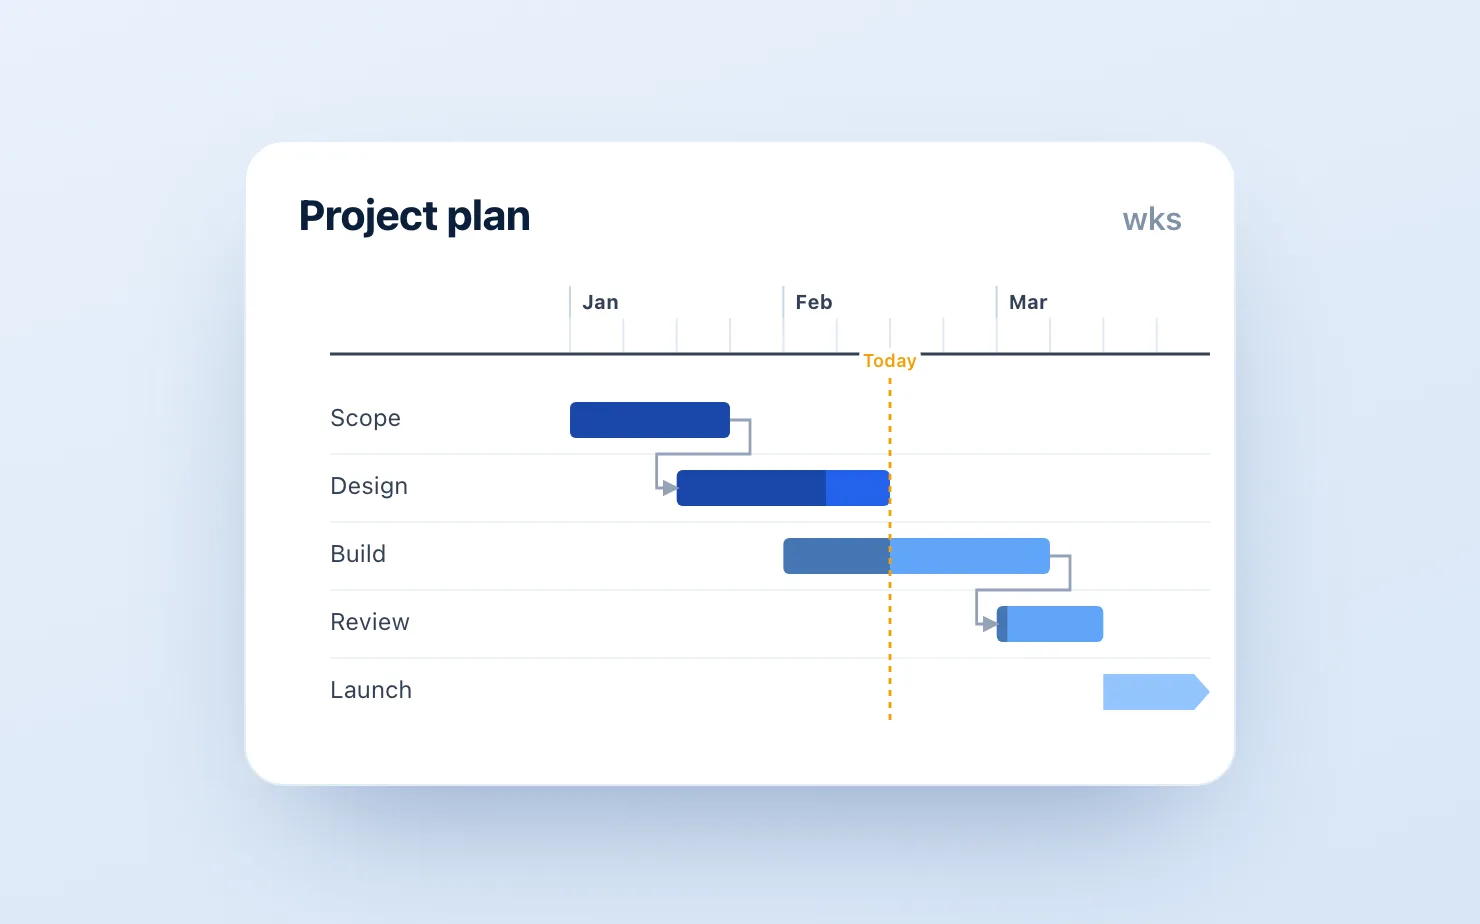
How to make a Gantt chart in Google Slides
TutorialMay 2026
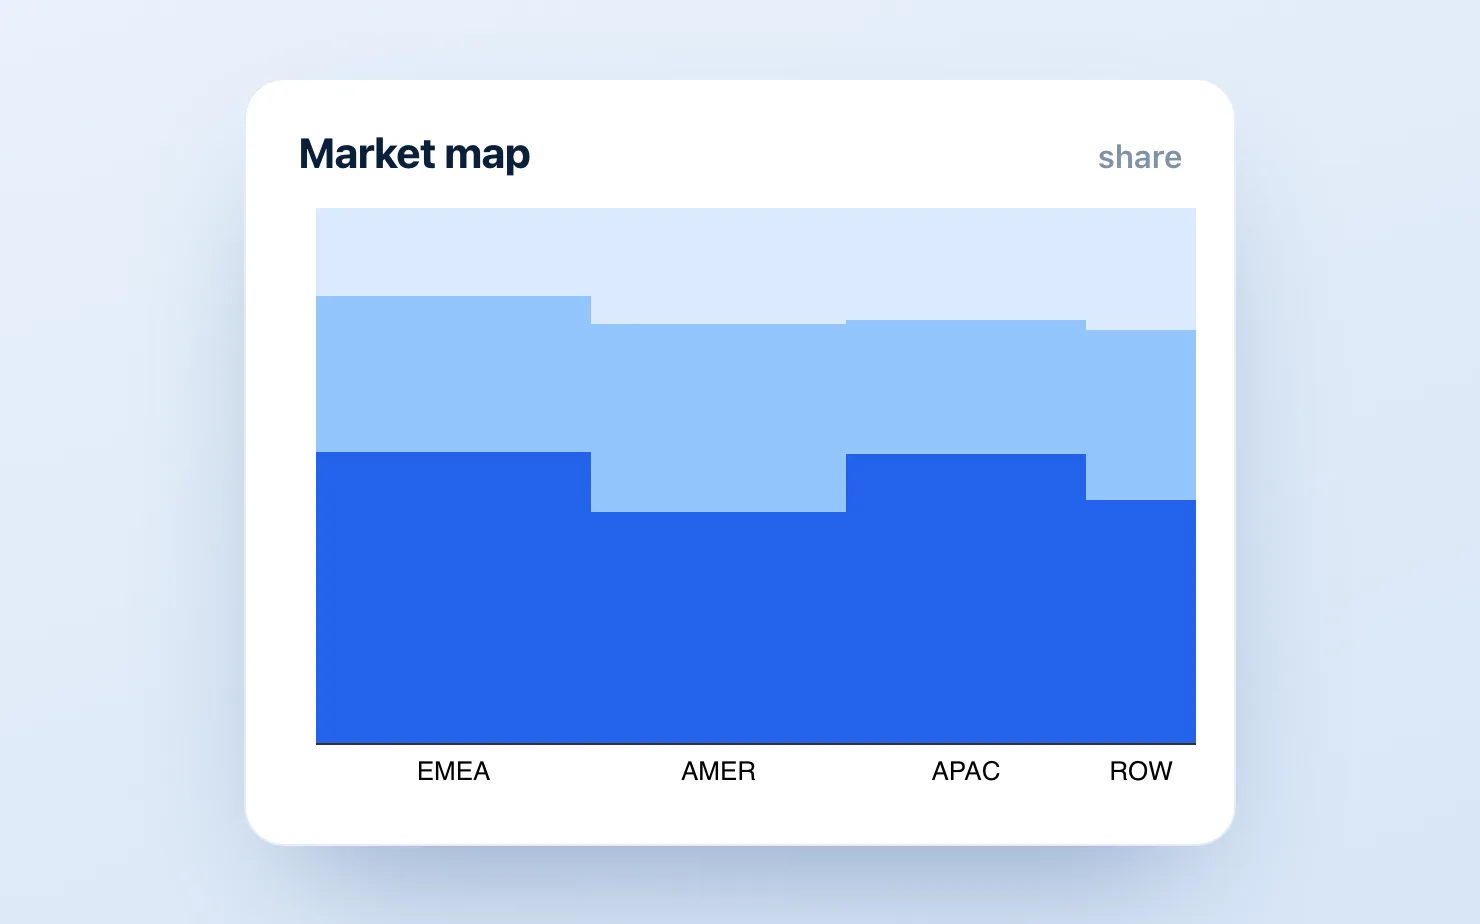
What is a Mekko chart — and how do you build one in Google Slides?
TutorialMay 2026
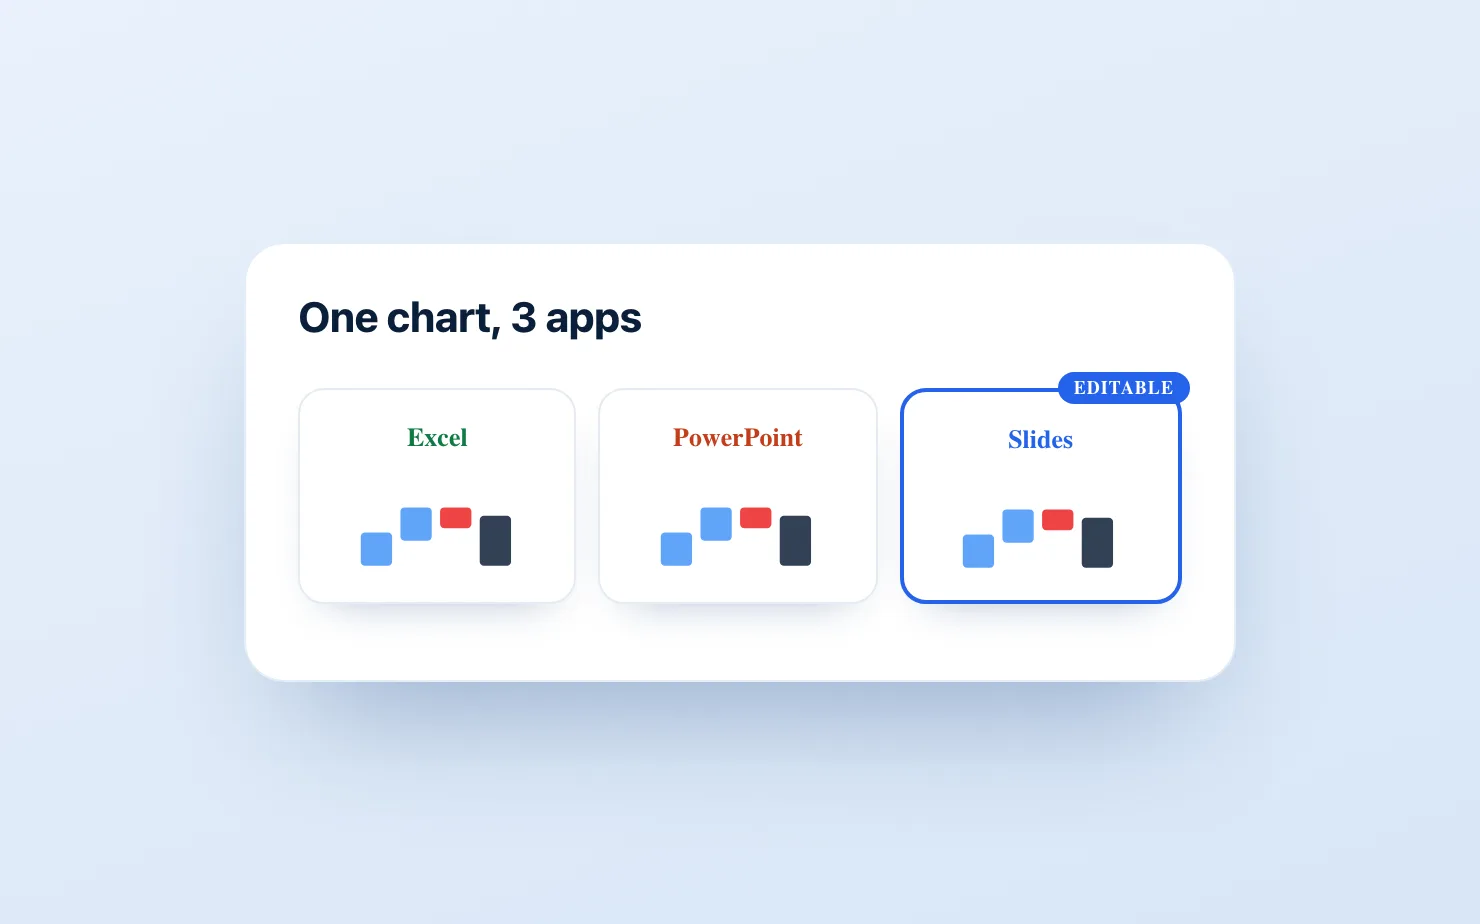
How to make a waterfall chart in Excel, PowerPoint, and Google Slides (2026)
Get new guides in your inbox.
One email when we publish something worth reading. No frequency commitments.