
Google Slides chart not updating from Sheets? How to fix it
15 min read
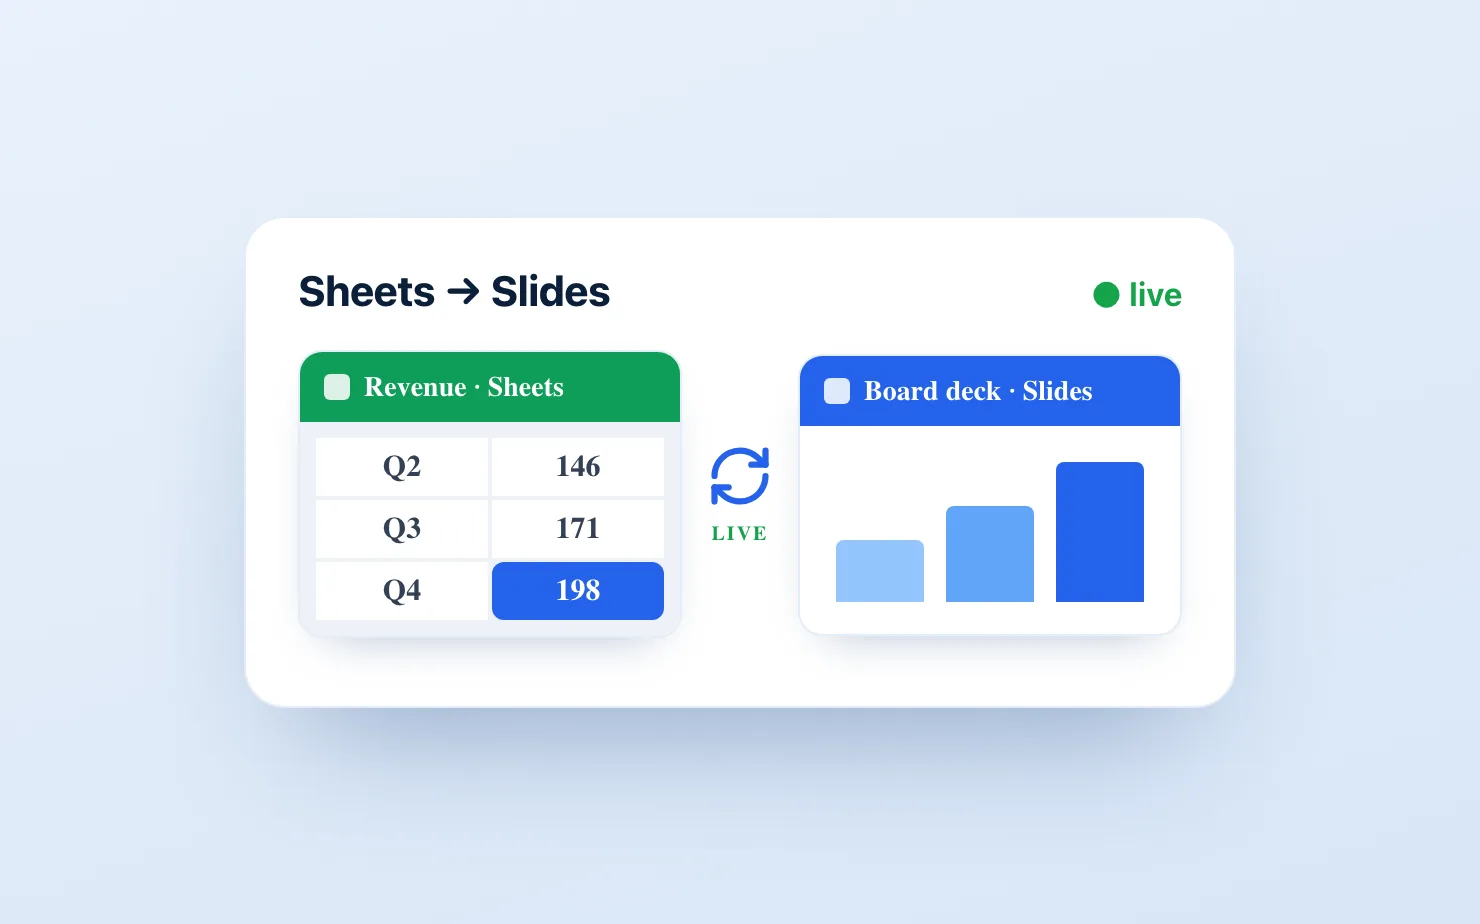
You built a chart from a Google Sheet, dropped it into a slide, and shipped the deck. Then the numbers changed — and now you're wondering whether there's a way to make the chart on the slide update itself, instead of rebuilding it every time.
Here's the fact the whole topic turns on: a linked chart's data connection is automatic, but the redraw is not. Slides never repaints a chart just because the sheet changed. Something has to trigger it — a human clicking Update, a script calling refresh(), or an add-on that syncs on its own. Most of the confusion around "auto-updating" charts comes from missing that one distinction.
It also matters how the chart got onto the slide in the first place. A linked chart — inserted via Insert → Chart → From Sheets with "Link to spreadsheet" checked — stays connected to its source. A chart imported without that link, or a pasted screenshot, is a static image, and nothing on this page can revive it.
This is the honest map of every option: the built-in link most people underuse, a free Apps Script that automates the refresh (full copy-paste code below), one-click refresh add-ons, Zapier and Make, and a charting add-on that syncs natively — plus a troubleshooting section for when a chart shows "No data" or the Update button vanishes.
The quick answer
Google Slides charts linked from Sheets don't push updates automatically — you (or a script) still have to trigger the redraw. Click Update on a single chart, use Tools → Linked objects → Update all to refresh every linked chart in the deck at once, automate it with Apps Script's refresh() method on a time-driven trigger, or use an add-on that keeps charts in sync without a manual refresh step.
Option 1: Link the chart to the sheet (built-in, and underused)
Google Slides has this natively. When you insert a chart, you can link it to its source spreadsheet:
- In Slides, click Insert → Chart → From Sheets.
- Pick the Google Sheet, then the specific chart from it.
- Import it with "Link to spreadsheet" checked. This checkbox is the whole mechanism — leave it unchecked and you get a static image with no connection to the sheet and no Update button, ever.
Now the chart carries an Update button whenever the sheet's data has moved, and one click redraws it with the new numbers. Fewer people know about the bulk version: Tools → Linked objects opens a sidebar listing every linked chart, table, and slide in the deck, with an Update all button at the bottom. If your deck has a dozen linked charts, that's one click instead of twelve.
This is the right answer for a lot of decks, and it's free. If you just need the basic mechanics of getting a Sheets chart onto a slide, we cover them step by step in how to insert a Google Sheets chart into Google Slides.
What actually triggers the update
This is the #1 misconception behind the whole topic, so to be precise: opening the presentation does not refresh linked charts. Neither does editing the sheet, nor presenting the deck. The only native triggers are a human clicking Update on a chart, or Update all in the Linked objects sidebar — and both require someone to have the file open. "Linked" means the connection exists; it does not mean the chart follows the data. If nobody opens the deck between the sheet changing and the meeting, the audience sees stale numbers.
Limits of native linked charts
Beyond the manual trigger, the native link has hard edges worth knowing before you build a reporting cycle on it:
- You're limited to the chart types Sheets can generate. Basic bar, column, line, pie. No waterfall charts, no Marimekko charts, no 100% stacked bars with totals, no Harvey balls — the charts a board or strategy deck actually needs.
- The link is brittle. Move, delete, or restrict the source sheet and the chart breaks — often silently, until someone clicks Update.
- Viewers need access to the source sheet. Anyone viewing the deck without at least view permission on the spreadsheet can see the chart render as "No data." Google's own support forums have years of threads on exactly this failure, because sharing a deck widely while the sheet stays private is the default way teams work.
- Refreshing replaces the chart wholesale. Any formatting applied on the Slides side doesn't survive an update — the chart comes back exactly as it looks in Sheets.
Option 2: Apps Script (free, for people who code)
You can automate the clicking with Google Apps Script. A script can walk every slide, find each linked chart, and call refresh() on it — and a time-driven trigger can run that script on a schedule, whether or not anyone has the deck open. This is the only free way to get a genuinely hands-off refresh, and it's a small, contained script rather than a real software project. Here it is in full.
The refresh script
Open your presentation, click Extensions → Apps Script, delete the placeholder code, and paste this:
function refreshCharts() {
  var slides = SlidesApp.getActivePresentation().getSlides();
  for (var i = 0; i < slides.length; i++) {
    var charts = slides[i].getSheetsCharts();
    for (var j = 0; j < charts.length; j++) {
      charts[j].refresh();
    }
  }
}
In plain English, line by line: SlidesApp.getActivePresentation() grabs the presentation the script is attached to, and .getSlides() returns its slides as a list. The outer loop visits each slide; getSheetsCharts() collects only the charts on that slide that are linked to a Google Sheet (static images and unlinked charts are ignored, which is what you want). The inner loop calls refresh() on each one — the same operation as clicking the Update button, documented in Google's SheetsChart reference. refresh() pulls the latest version of the chart from the sheet and swaps it in; if nothing changed, it's a no-op. It never duplicates charts, so running it repeatedly is safe.
Click Run once to test it. The first run triggers an authorization prompt — more on that below.
Add a custom menu button (one-click refresh)
If you want easy-but-manual rather than scheduled — refresh on demand without opening the script editor — add this to the same file:
function onOpen() {
  SlidesApp.getUi()
    .createMenu('Charts')
    .addItem('Refresh all charts', 'refreshCharts')
    .addToUi();
}
onOpen() is a special function name Apps Script runs automatically every time the presentation is opened. This one adds a Charts menu to the Slides menu bar with a single item that runs the refresh script. Reload the deck and it appears; from then on, refreshing every chart is one menu click for anyone with edit access.
Automate it with a time-driven trigger
For the truly automatic version — charts that refresh on a schedule with nobody touching the file:
- In the Apps Script editor, click the Triggers (alarm clock) icon in the left sidebar.
- Click Add Trigger.
- Choose
refreshChartsas the function, Time-driven as the event source, and an interval — every hour, or a minutes timer at every 15 or 30 minutes. - Save, and complete the authorization prompt if one appears.
On interval choice: some guides floating around recommend an every-minute trigger. Don't. Apps Script has daily execution quotas, and a minute-level trigger runs 1,440 times a day to redraw charts nobody is looking at — it burns quota and API calls for zero practical benefit. If your deck is reviewed daily, an hourly refresh means the numbers are never more than an hour stale; every 15 minutes covers even a live dashboard-style deck comfortably.
Permissions and authorization
The first time you run the script (or the first time a trigger fires), Google shows an OAuth consent screen listing what the script needs: access to your presentations, plus read access to your spreadsheets — the spreadsheets.readonly scope is what refresh() requires to pull chart data. Apps Script detects these scopes automatically; you don't declare anything.
Because it's your own script rather than a published app, you may see a "Google hasn't verified this app" warning. That's expected for personal scripts — click Advanced → Go to (project name) to proceed. You're authorizing your own code against your own files.
One genuine blocker: on managed Google Workspace accounts, admins can restrict Apps Script authorization entirely. If the consent screen errors out instead of completing, that's an admin-policy conversation, not a bug in the script.
Refresh charts across multiple presentations
The script above is bound to one deck. If you maintain a library — the same monthly pack in five variants, say — a standalone script (create one at script.google.com) can loop over presentation IDs instead:
function refreshAllDecks() {
  var deckIds = [
    'PRESENTATION_ID_1',
    'PRESENTATION_ID_2'
  ];
  for (var d = 0; d < deckIds.length; d++) {
    var slides = SlidesApp.openById(deckIds[d]).getSlides();
    for (var i = 0; i < slides.length; i++) {
      var charts = slides[i].getSheetsCharts();
      for (var j = 0; j < charts.length; j++) {
        charts[j].refresh();
      }
    }
  }
}
Each ID is the long string in a presentation's URL between /d/ and /edit. Same logic, same trigger setup — one schedule now keeps the whole deck library current. You need edit access to every deck in the list.
Troubleshooting
The refresh machinery fails in a handful of predictable ways. Each one has a specific cause.
The chart shows "No data" after linking or refreshing
Cause: almost always a permissions mismatch — the person viewing the slide doesn't have at least view access to the source spreadsheet, or the sheet (or the chart inside it) was deleted or moved. Fix: share the sheet with the same audience as the deck, then update the chart again. If the source chart was deleted in Sheets, re-create it there and re-insert.
The Update button is greyed out or missing
Cause: the chart isn't actually linked — it was imported with "Link to spreadsheet" unchecked, pasted as an image, or the source was deleted, which severs the link permanently. Fix: there's no way to re-link an unlinked chart; re-insert it via Insert → Chart → From Sheets with the checkbox on. Check Tools → Linked objects — if the chart isn't listed there, it isn't linked.
Apps Script throws an authorization or permission error
Cause: the first-run consent flow was never completed, or the script was edited in a way that needs new scopes. Fix: run the function manually from the editor once and complete the full consent flow, including the "unverified app" step. If it still fails on a work account, ask your admin whether Apps Script authorization is restricted.
The trigger stopped firing
Cause: Apps Script disables triggers that fail repeatedly — commonly because the deck or sheet was deleted, or the owning account lost access — and a disabled trigger fails silently. Fix: open the script's Executions log in the left sidebar to see the errors, resolve the underlying access problem, then delete and re-create the trigger. If a deck was retired, remove its ID from the multi-deck script.
The refreshed chart lost my formatting
Cause: not a bug — a hard limit. refresh() and the Update button replace the chart with the version rendered in Sheets, so any styling done on the Slides side is discarded every cycle. Fix: either do all formatting in Sheets (within what its chart editor allows), or accept that this is where the native pipeline ends and a syncing add-on that separates data from styling begins — see Option 4.
Option 3: Zapier or Make (paid, no code)
Automation platforms like Zapier and Make connect Google Sheets to Google Slides without writing code, and they're often suggested for this problem. Honest precision matters here, because they solve a different problem than the one this page is about.
What they're good at: generating presentations from a template — "when a row is added to this sheet, create a new deck and fill in these text placeholders and values." That's genuinely useful for repetitive deck production (one deck per client, per week, per campaign).
What they don't do: neither platform has an action that presses Update on an existing linked chart. Their Slides integrations work with text placeholders and template copies, not native chart objects. So for the specific job of keeping a chart on an existing slide in sync with a sheet, middleware doesn't reach the chart — and you'd be paying (meaningful usage lands roughly in the $10–30/month tier and up) for a tool aimed at something else.
When it's still the right call: your team already runs Zapier or Make for other workflows and your actual need is generating fresh decks from data, not refreshing charts in a living deck. For chart refresh specifically, the Apps Script above does more, for free.
Option 4: An add-on that syncs natively (works out of the box)
The Google Workspace Marketplace has a spread of add-ons attacking this problem, and they're not all the same thing, so here's the landscape.
At the simple end are single-purpose refresh helpers — the best known is Refresh Charts Button, which adds a one-click "refresh everything" control inside Slides. That's a legitimate small win: it's the Apps Script menu-button pattern without writing the script. But it's still manual (someone clicks), and it still refreshes Google's chart types with all of Option 1's limits — chart selection, formatting loss on refresh, the works.
The fuller answer is an add-on where sync is native to how the charts work, which is the gap ChartKit fills — and the reason to reach for it isn't only automation, it's that it works out of the box. Install the extension, point a chart at a sheet range, done. No script to write and authorize, no trigger to babysit, no automation subscription wired between two apps:
- Point any chart at a sheet range once; it renders and shows a Synced badge.
- When the numbers move, the chart re-renders — hit Refresh, or let it sync when you open the deck.
- Sync updates the data only. Your labels, totals, deltas, colors, and annotations stay exactly as set — the chart doesn't reset when the data changes, which is precisely the formatting problem native refresh can't solve.
The other half of the case is chart types. If the deck needs a waterfall, a Marimekko, a 100% stacked bar with totals, or Harvey balls, no amount of automating the native link helps — Sheets can't build those charts in the first place. ChartKit builds think-cell-style charts directly inside Google Slides, so the thing staying in sync is a board-grade chart, not a basic column chart refreshed faster.
ChartKit is free to install — 10 charts a month on the Free plan — with unlimited at €10/month. Details of what shipped: your Slides charts now live-sync with Google Sheets.
Comparison: which method should you use?
| Method | Setup effort | Cost | Truly automatic? | Chart types | Best for |
|---|---|---|---|---|---|
| Native linked chart | ~1 min | Free | No — manual Update / Update all | Sheets basics (bar, line, pie) | Occasional decks, simple charts |
| Apps Script + trigger | ~15 min once | Free | Yes — on a schedule | Sheets basics | Technical owners of recurring decks |
| Zapier / Make | ~30 min | From ~$10–30/mo | Partly — generates decks, can't refresh charts | Template text/values, not chart objects | Deck generation, not chart refresh |
| Refresh-button add-on | ~2 min | Free | No — one click, but a click | Sheets basics | Non-coders who want the bulk-update click |
| ChartKit | ~2 min | Free plan; €10/mo unlimited | Yes — syncs without a refresh step | Adds waterfall, Mekko, 100% stack, stacked and clustered bars with deltas/totals | Recurring board-grade decks |
Reading the table honestly: if your chart is a basic bar or line and the deck ships quarterly, the native link plus Update all is enough — just know it's manual. If you can code and the deck recurs, the Apps Script is the best free automation available and takes fifteen minutes to set up. Zapier and Make are the right tools for a different job. And if the deck needs consultant chart types, or you're tired of formatting evaporating on every refresh, the add-on route is the only one that fixes the chart itself rather than the clicking.
Common questions
Does Google Slides refresh linked charts automatically?
No. A linked chart's data stays connected to the source sheet, but Slides only redraws it when you click Update (or Tools → Linked objects → Update all), or when a script calls refresh(). Nothing updates just because the sheet changed.
How do I refresh linked charts in Google Slides with Apps Script?
Use the SheetsChart class's refresh() method: loop through SlidesApp.getActivePresentation().getSlides(), call getSheetsCharts() on each slide, then refresh() on each chart. The full copy-paste script is in Option 2 above.
What does SheetsChart.refresh() actually do? It replaces the chart in your presentation with the latest version pulled from the linked Google Sheet. If the chart is already current, nothing changes — it's safe to call on a timer without duplicating anything.
How do I auto-refresh all charts in a presentation on a schedule? Wrap the refresh script in a function, then add a time-driven trigger (Triggers → Add Trigger → Time-driven) set to every 15–60 minutes. Avoid one-minute intervals — they burn Apps Script execution quota for no real benefit.
Why is my linked chart showing "No data"? Usually a permissions mismatch — the viewer doesn't have access to the source sheet, or the sheet or chart was deleted or moved. Re-share the sheet with the same audience as the deck. The full walkthrough is in Troubleshooting above.
Can I update Google Slides linked objects without opening the file? Not with the native Update button — that needs a human with the file open. An Apps Script time-driven trigger is the only free way to refresh charts without anyone opening the presentation.
What permissions does an Apps Script chart-refresh script need?
The spreadsheets.readonly scope at minimum, alongside the presentations scope Apps Script requests automatically. Expect a one-time OAuth consent screen on first run; workspace admins can block authorization on managed accounts, which is the most common "script won't authorize" cause.
Is there a way to refresh charts without writing a script? Yes — either a one-click helper like the Refresh Charts Button add-on (manual, native chart types only), or a syncing add-on like ChartKit, which keeps charts live with no refresh step and adds chart types like waterfalls and Marimekkos that native Slides charts can't build at all.
Bottom line
The decision framework is short. Native linking plus Update all for the occasional deck with basic charts — free, manual, fine. The Apps Script above if you're technical and want free, scheduled automation of those same basic charts. And an add-on that syncs natively when the deck recurs and the charts need to be board-grade — the one route where the update problem and the chart-quality problem get solved together, with nothing to maintain.
Download and try ChartKit for free — 10 charts a month on the Free plan, no card required.