
New in ChartKit: your Slides charts now live-sync with Google Sheets
3 min read
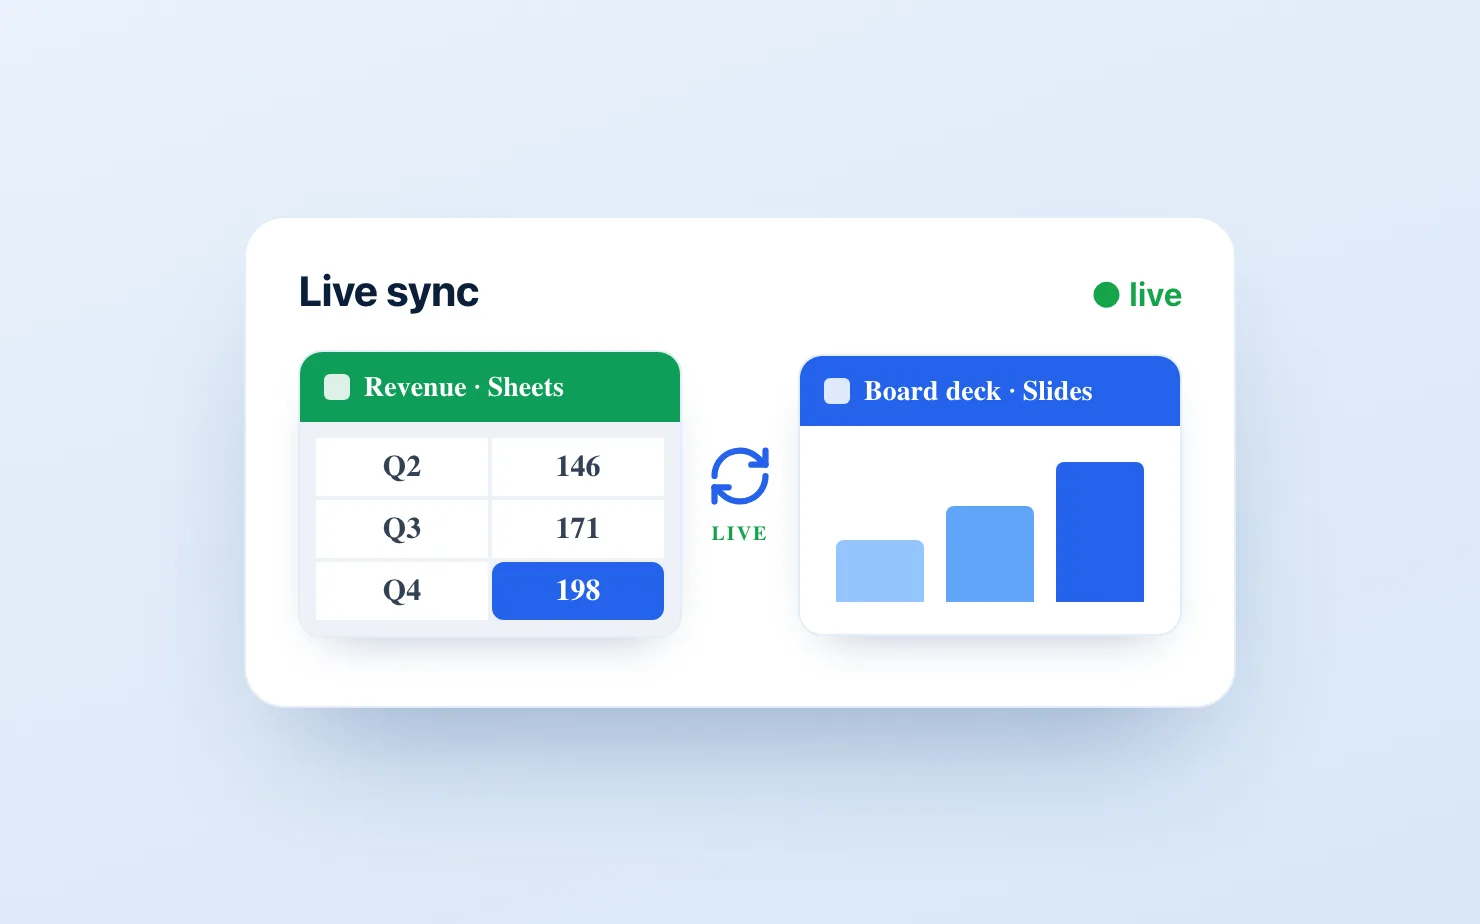
The most common thing that breaks a deck isn't a typo or a bad template — it's a number that changed after you built the chart. You update the model in Sheets, and every chart you screenshotted into Slides last week is now quietly wrong.
I've hit this more times than I can count. A client asks for an updated deck off an updated model, and not only do you have to rebuild the model with new data and new assumptions — you then have to update the data for every single chart by hand. It was a pain.
Today's release closes that gap. ChartKit charts can now connect to a Google Sheet and stay in sync. Point a chart at a range once; when the data in that range moves, the chart on your slide re-renders to match. No re-export, no re-paste, no "which version is this."
What shipped
- Connect to Sheets — pick a Google Sheet and a cell range as the source for any ChartKit chart (stacked bar, 100% stack, line, waterfall, and the rest).
- A "Synced" badge on the chart so you can see at a glance that it's live, not a dead image.
- Refresh on demand or on open — hit Refresh anytime, or let the chart pull the latest values when you open the deck.
- The whole chart stays editable. Sync updates the numbers; your labels, totals, deltas, colors, and annotations stay exactly as you set them. The chart doesn't reset to a default when the data changes.
This is the piece that makes ChartKit usable for anything recurring — a monthly board pack, a weekly pipeline review, a quarterly update — where the deck outlives the data.
How to use it
- Build or open a ChartKit chart on your slide.
- Click Connect to Sheets and choose the sheet and range that holds the data.
- ChartKit renders the chart and shows the Synced badge.
- When the numbers change, hit Refresh — or reopen the deck and let it sync on open.
That's the whole loop. The chart is still a native ChartKit chart, so everything you'd normally do — segment labels, bold totals above the stack, growth deltas, axis breaks — works on top of the live data.
Why this matters more than it sounds
Google Slides does have a native "link to spreadsheet" option, and it comes with an Update button that pulls the latest numbers. That part works. The limit is what it works on — linking only covers Google's own chart types, so the moment a slide needs a waterfall, a 100% stack with totals above each column, or a delta between two bars, there's nothing for the update function to update.
ChartKit's live sync is that same functionality on the charts Google doesn't have — the consultant chart types, with the labels and annotations those slides need, kept current from a single connected range.
If you keep decks that get rebuilt every reporting cycle, this is the update that stops the rebuild. We wrote a fuller, tool-agnostic guide to the whole problem — native linking, the Apps Script hack, Zapier, and where each runs out of road — here: How to make Google Slides charts update automatically from Google Sheets.
Live sync is in ChartKit today, on the Free plan too.
Download and try ChartKit for free — 10 charts a month on the Free plan, no card required.