
ChartKit vs ChartBuddy for Google Slides (2026)
4 min read
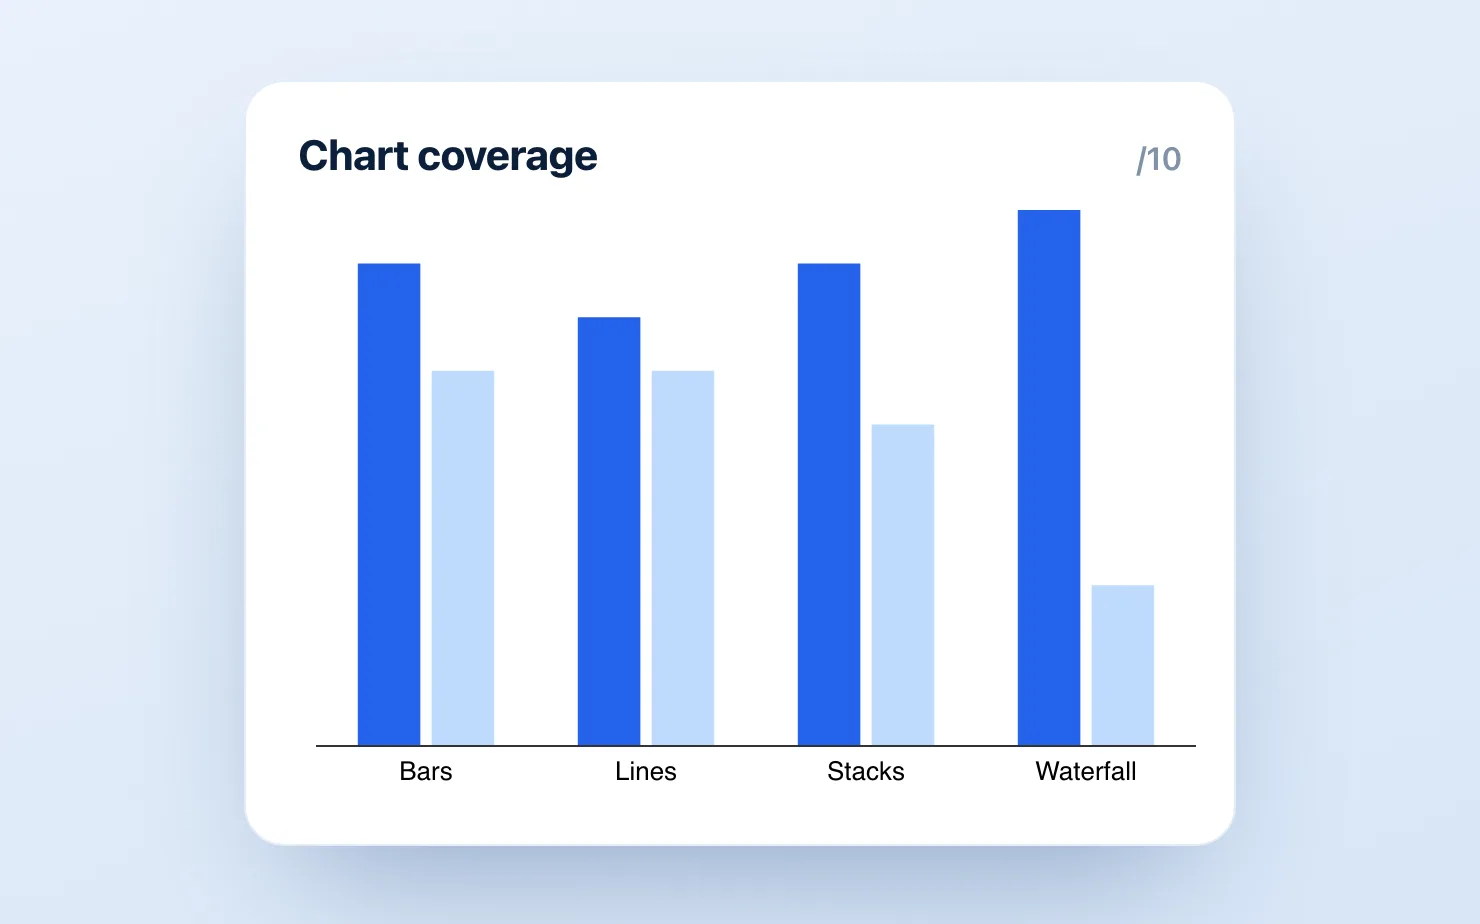
If you build charts in Google Slides and you've decided against the screenshot-from-PowerPoint workflow, you've probably narrowed the field to the two native add-ons that show up again and again - ChartBuddy and ChartKit. We built ChartKit, so we have a stake here. We'll be upfront about where ChartBuddy is the better pick.
The short version - the two tools have converged on chart coverage, so it now comes down to a few specifics. ChartBuddy still wins if you need Gantt or funnel charts. ChartKit wins on live Google Sheets sync, axis breaks, and price. Which matters depends on the decks you actually build.
Where ChartBuddy is stronger
ChartBuddy has been around longer and carries a wider chart-type library - 15+ types, including Gantt charts and funnel charts that ChartKit does not offer today. If your work regularly needs those two specific chart types, ChartBuddy is the more complete tool and the one we'd point you to. It's also the more established option in the Google Workspace Marketplace, with a longer review history.
In other words, if Gantt or funnel charts are a hard requirement, this comparison is short - use ChartBuddy.
Where ChartKit is stronger
ChartKit covers the charts that fill recurring business decks - waterfalls, stacked bars, 100% bars, line, mekko, pie, bubble, and scatter - and focuses on the workflow of updating them every cycle without a rebuild.
- A real free plan. 10 charts a month, every chart type, no card - not a countdown trial. Paid Pro only lifts the cap.
- Live Google Sheets sync. Connect a chart to a Sheets range once, and it re-renders when the data changes - no re-export, no stale decks. ChartBuddy has no equivalent.
- Storytelling controls where they matter. Totals, deltas, segment labels, annotations, and axis breaks are built in, so the takeaway reads without hand-drawn text boxes. Axis breaks in particular are something ChartBuddy doesn't offer.
- Google Workspace-wide. ChartKit works across Google Slides, Docs, and Sheets, not Slides alone.
- Lower price. Free for the first 10 charts each month, then €10/month or €80/year (about €7/month), against ChartBuddy's ~€10/month.
The chart libraries have largely converged. The difference now is the data workflow around them.
Feature comparison
| ChartKit | ChartBuddy | |
|---|---|---|
| Platform | Slides, Docs, Sheets | Google Slides |
| Waterfall / bridge charts | ✅ | ✅ |
| Stacked & 100% bar charts | ✅ | ✅ |
| Mekko / pie / bubble / scatter | ✅ | ✅ |
| Gantt charts | ❌ | ✅ |
| Funnel charts | ❌ | ✅ |
| Live Google Sheets sync | ✅ | ❌ |
| Deltas, totals, annotations | ✅ | ✅ |
| Axis breaks | ✅ | ❌ |
| Editing without leaving the slide | ✅ | ✅ |
| Free plan | 10 charts/mo, no card | ❌ |
| Price for unlimited | €10/mo (€80/yr) | ~€10/mo |
| Free trial | 14-day Pro trial | Yes |
So which should you choose?
Choose ChartBuddy if your decks specifically need Gantt or funnel charts - that's its clearest remaining advantage.
Choose ChartKit if you want live Google Sheets sync and axis breaks on the management-deck charts you update every cycle - across Slides, Docs, and Sheets, at a lower price.
The honest test is your own deck. ChartKit is free to install and ChartBuddy has a trial, so build the chart you rebuild most often in each and see which one gets you there faster. For the wider view including think-cell and native Slides charts, see our full think-cell alternative comparison, and if waterfalls are your main use case, the Google Slides waterfall guide walks through the workflow in detail.
If your decks live in Google Slides and lean on management-deck charts, build your most-rebuilt chart in ChartKit in about 90 seconds.
Download and try ChartKit for free — 10 charts a month on the Free plan, no card required.