
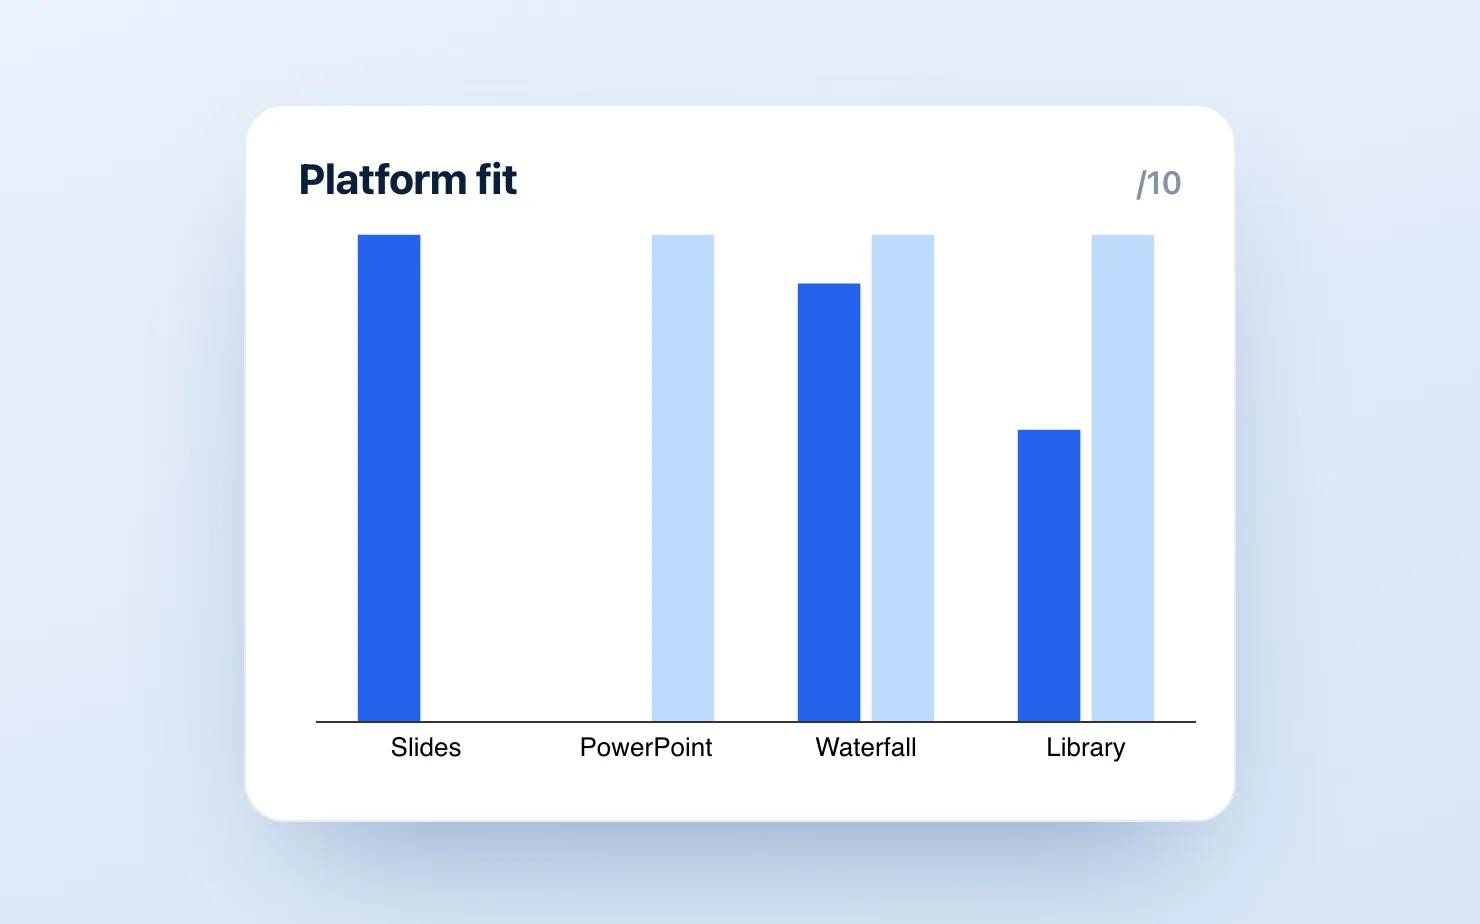
If you're searching for a think-cell vs ChartKit comparison, the honest answer starts with an asymmetry. These two tools never compete on the same slide. Think-cell runs only in PowerPoint. ChartKit runs only in Google Workspace. So the real question isn't which tool is better in a feature-by-feature shootout - it's which one exists on the platform your team actually presents from.
We build ChartKit, so read this knowing we have a stake. We'll be direct about where think-cell is simply better, because in its own arena it usually is.
Think-cell is the chart standard for PowerPoint at roughly €600 per user per year. It does not run in Google Slides. ChartKit builds the core management-deck charts natively in Slides with live Google Sheets sync, from €0.
The platform line neither tool crosses
Think-cell is a deep PowerPoint add-in. It hooks into PowerPoint's chart and shape engine, which is exactly what makes it fast and polished - and exactly why it can't follow you to Google Slides. There is no think-cell plugin, web version, or compatibility mode for Slides, and think-cell has said it doesn't plan to build one. Its own support documentation tells users moving a deck to Google to convert their charts to images first. We unpacked the full story in why think-cell doesn't work in Google Slides.
ChartKit sits on the other side of the same line. It's a Chrome extension that creates and edits charts directly inside Google Slides, Docs, and Sheets. It doesn't run in PowerPoint, and it isn't trying to.
In other words, if your firm presents from PowerPoint, think-cell wins this comparison by default. If your team lives in Google Workspace, think-cell isn't in the running at all. The rest of this post covers the two situations where the comparison is genuinely live - teams choosing a platform, and people moving from one to the other.
Where think-cell is stronger
Inside PowerPoint, think-cell has earned its position. Consultants and bankers standardized on it for good reasons.
- Chart-type breadth. Waterfalls, Mekkos, Gantts, CAGR labels, difference arrows - the full management-consulting toolkit, refined over two decades. ChartKit covers the recurring core of that set and stops there.
- Speed under deadline. A clean chart in a couple of minutes, with automatic label placement that just works. This is the muscle memory every ex-consultant misses.
- Organizational trust. Think-cell is battle-tested in professional services. Procurement knows it, IT knows it, and every new analyst learns it in week one.
If your team is committed to PowerPoint and the budget covers roughly €600 per user per year, we have no counter-argument. Buy think-cell.
Where ChartKit is stronger
ChartKit's case rests on one fact and one bet. The fact is that think-cell doesn't exist where a growing share of business decks are built. The bet is that for recurring decks, what happens when the data changes matters more than the size of the chart library.
- It actually runs in Google Slides. Charts are created and re-edited directly on the slide - no export loop, no screenshots, no flattened images that die at the first data update.
- Live Google Sheets sync. Connect a chart to a Sheets range once and it re-renders in the deck when the numbers change (here's how the live connection works). Think-cell links to Excel, but that entire workflow stays locked inside PowerPoint.
- The consultant chart set, natively. Waterfalls and bridges with subtotals, connectors, and axis breaks, stacked and 100% bars, Mekko charts, line charts with CAGR annotations - plus totals, deltas, segment labels, and annotations so the takeaway reads without hand-drawn text boxes.
- Price. ChartKit is free for 10 charts a month - every chart type, no watermark, no card. Unlimited is €10/month or €80/year (about €7/month). That's an order of magnitude below think-cell's per-seat cost.
The honest gaps run the other way too. ChartKit's library is smaller than think-cell's. Gantt charts are built but still rolling out, so if a Gantt in Slides is a hard requirement this week, ChartBuddy is the safer native pick. And there's no funnel chart today.
Feature comparison
| Think-cell | ChartKit | |
|---|---|---|
| Platform | PowerPoint only | Google Slides, Docs, Sheets |
| Where you edit | On the PowerPoint slide | Directly on the Google slide |
| Waterfall / bridge charts | ✅ | ✅ Native, with axis breaks |
| Mekko charts | ✅ | ✅ |
| Gantt charts | ✅ | Rolling out |
| CAGR, deltas, annotations | ✅ | ✅ |
| Live spreadsheet link | Excel, inside PowerPoint | Google Sheets, auto re-render |
| Works in Google Slides | ❌ (images only) | ✅ |
| Free plan | ❌ | 10 charts/mo, no watermark |
| Price | ~€600/user/year | €10/mo or €80/yr |
Think-cell's pricing and platform position come from its own site and documentation as of August 2026 - check current figures if you're reading this later.
The migration case, concretely
The most common person searching this comparison isn't choosing between two installs. They're an ex-consultant or a finance hire who spent years on think-cell and just joined a company that runs on Google Workspace. The muscle memory says "insert waterfall", and the platform says no.
The screenshot workaround - build in PowerPoint, export images, paste into Slides - survives about two reporting cycles. Every data change means rebuilding the chart in one tool and re-pasting it into the other, and collaborative editing dies because nobody else can touch the charts. Most teams that try it abandon it quickly.
ChartKit is built for exactly this landing spot. The chart types match the management-deck habits, the storytelling controls (totals, deltas, axis breaks) carry over, and the charts stay editable in the deck where your team already works. We wrote a broader ex-consultant's guide to Google Slides for the rest of that transition, and if you want the full landscape beyond these two tools, the think-cell alternatives roundup compares four options side by side.
So which should you choose?
Choose think-cell if your firm presents from PowerPoint. It has the deepest chart library and two decades of polish, and ChartKit doesn't compete on its platform.
Choose ChartKit if your team works in Google Slides. Think-cell can't follow you there, and ChartKit builds the charts you'd miss most - waterfalls, stacked bars, Mekkos - natively on the slide, connected live to Google Sheets, at a fraction of the seat cost.
Split across both? Teams presenting from both platforms usually keep think-cell for the PowerPoint side and add ChartKit for the Slides side. At €0 to start, the Google half of that setup costs nothing to test.
The test is one deck. Take the chart you rebuild every month, build it in ChartKit, then change the numbers and watch what happens.
Download and try ChartKit for free — 10 charts a month on the Free plan, no card required.