If you've ever sat in a strategy review at McKinsey, BCG, or Bain, you've seen a Mekko chart — probably on the market-sizing slide. It's the chart that shows two dimensions of proportion at once: how big each market segment is, and how it splits internally.
And if you've since moved to a company that runs on Google Slides, you've discovered the bad news: there is no Mekko chart anywhere in Google Workspace. Not in Slides, not in Sheets, not in the chart editor. This article explains what the chart is, when you actually need it, and the real options for building one — honestly, including the fact that ChartKit doesn't have one yet either.
What a Mekko chart is
A Mekko (or Marimekko) chart is a stacked bar chart where the bar widths also carry data. In a normal 100% stacked bar, every column is the same width. In a Mekko:
- Column width = the size of that segment (e.g., each region's share of total market)
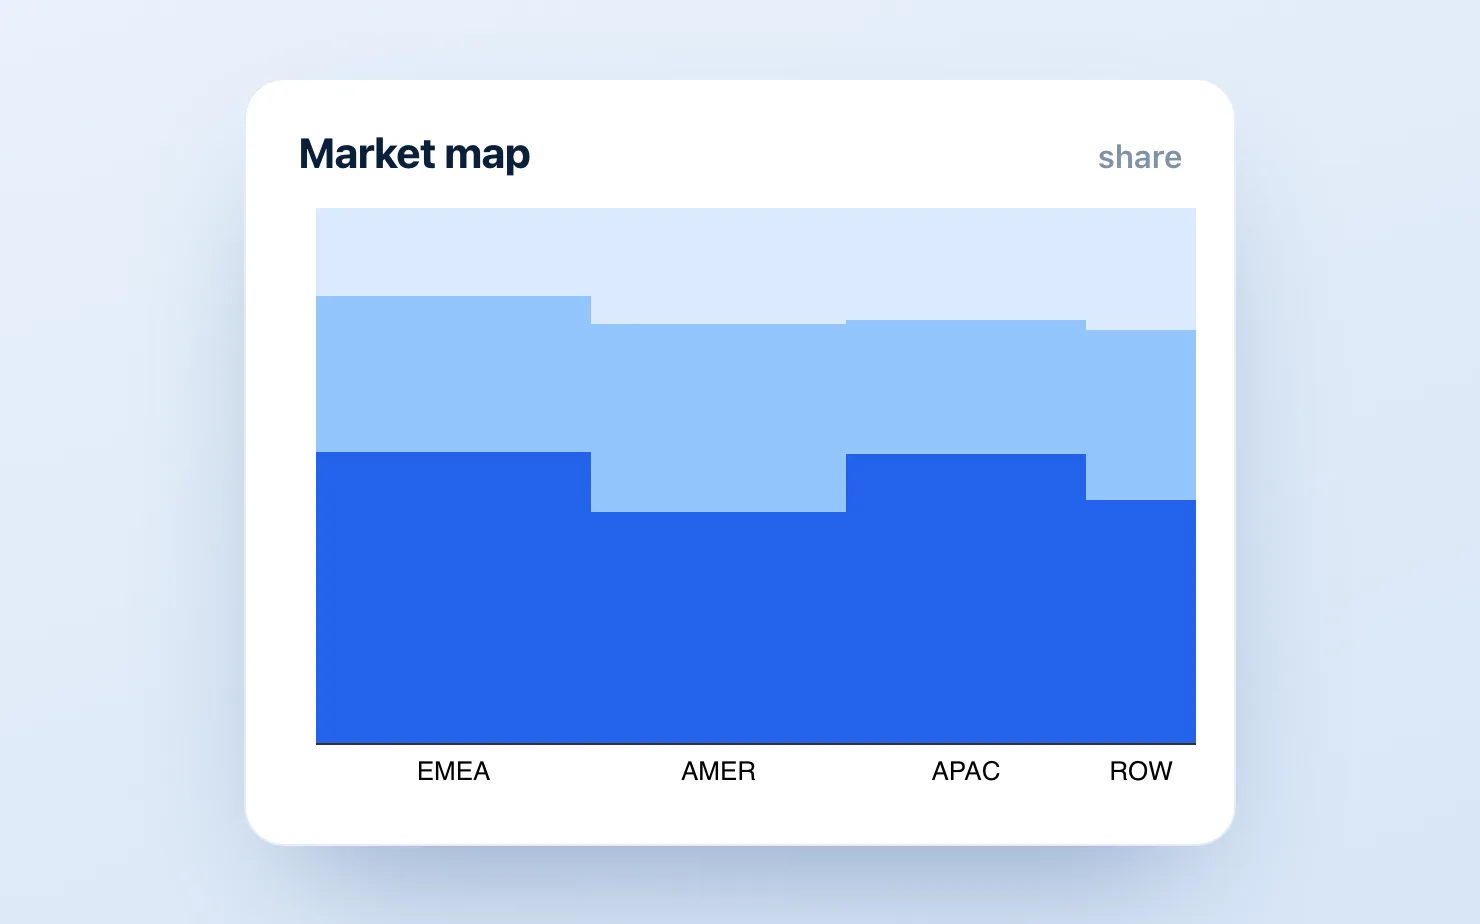
- Stack within the column = the composition of that segment (e.g., competitor share within the region)
The result is a complete market map on one chart: a wide column with a tall segment is a big market where one player dominates; a narrow column split many ways is a small, fragmented one. The total area of each block is proportional to its absolute value — which is why consultants love it for "where should we play?" discussions.
When to use it: market sizing, competitive landscapes, portfolio reviews, revenue by region × product. When not to: more than ~6 columns or ~5 stack segments, small differences that matter (area comparisons are imprecise), or any audience that hasn't seen one before without a 20-second explanation.
The options in Google Slides, honestly
1. Fake it with a table of rectangles (free, hard)
A Mekko is geometrically just rectangles whose widths and heights you calculate. The manual method:
- In Sheets, compute each column's width as a % of the total market, and each segment's height as a % of its column.
- In Slides, draw rectangles to those proportions against a fixed chart area (e.g., a 20cm × 12cm frame: a 35% column = 7cm wide).
- Label each block; add column totals on top.
It works, and the math is honest. But it takes 45–90 minutes, every data revision means recomputing and redrawing, and getting labels to fit inside narrow columns is its own small purgatory. Build one this way and you'll understand exactly why think-cell charges €600/year.
2. Build it elsewhere and paste an image (free-ish, the screenshot loop)
Excel with a Mekko template, think-cell on a side PowerPoint, or a web tool — then screenshot into Slides. Since think-cell runs only in PowerPoint, this is the only way to get its charts into a Slides deck at all. It produces a good-looking chart and a maintenance trap: the image is dead, and every update repeats the loop.
3. A native add-on (paid, the practical answer today)
Two Google Slides add-ons currently offer native Mekko charts:
- ChartBuddy (~€10/mo) — a real Marimekko type among its 15+ chart library; the most established option. See the full think-cell alternative comparison for how it stacks up against the other native tools.
- Charta ($12–29/mo) — a newer AI-prompt-driven tool that includes Mekko.
For this specific chart type, those are the tools to trial. ChartKit does not have a Mekko chart today. It's on our roadmap — it's the most-requested missing type — but we'd rather tell you that plainly than write a comparison that pretends otherwise. Where ChartKit fits in the same deck: the waterfalls, stacked bars, and 100% bars that surround the market-map slide, with the storytelling controls (deltas, totals, annotations, axis breaks) those slides need.
4. Substitute a 100% stacked bar (free, often sufficient)
Here's the consulting secret: a meaningful share of Mekko slides don't need to be Mekkos. If the segment sizes are roughly similar, or if absolute size is already on another slide, a 100% stacked bar with a total label above each column communicates the same composition story with none of the geometry pain. ChartKit builds those natively in about a minute. Before spending an hour on rectangles, check whether the width dimension is actually doing work on your slide.
Common questions
Is a Mekko chart the same as a Marimekko chart? Yes — "Mekko" is the consulting shorthand. (The name comes from a pattern by the Finnish design house Marimekko; the fashion brand has nothing to do with the chart, which is worth knowing when you search for it.)
Can Google Sheets make a Marimekko chart? No. There's no Mekko type in the Sheets chart editor, and no supported workaround that produces variable-width stacked columns.
What's the cheapest way to get Mekko charts in Google Slides? ChartBuddy at ~€10/month is the established native option. The manual rectangle method is free if your time isn't.
And if the slide turns out to need a 100% stacked bar rather than a true Mekko — as many do — get started for free and build it natively in Google Slides in about a minute.