
If you're comparing Vizzlo and ChartKit, you've already decided the native Google Slides chart tool isn't enough - and you're right, it runs out at the first waterfall or Mekko. We build ChartKit, so read this knowing we have a stake. We'll be specific about where Vizzlo is the better tool, because it genuinely is for some decks.
The two products look similar on a feature list and work completely differently in practice. Vizzlo is a full charting studio - a web app and desktop apps with a library of 120+ chart types - that connects to Slides through a sidebar add-on. ChartKit is a Chrome extension that creates and edits charts directly on the slide you're working on, inside Google Slides, Docs, and Sheets.
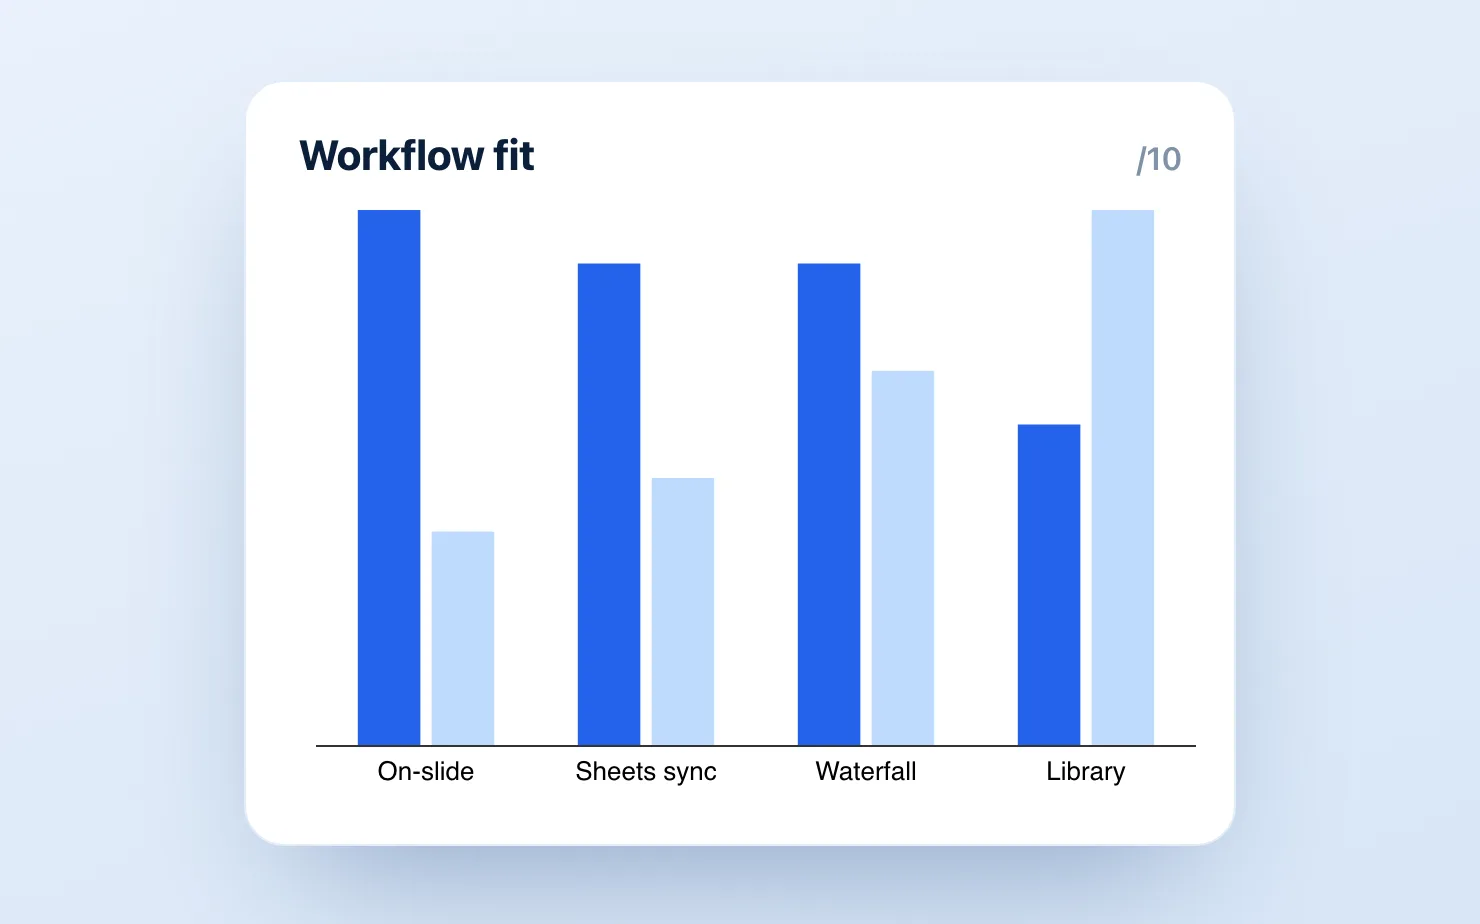
Vizzlo is a separate chart studio with 120+ chart types that you insert into Slides. ChartKit builds a smaller set of business charts directly on the slide, with live Google Sheets sync. Choose by workflow, not by feature count.
In other words, the decision isn't really about chart types. It's about where you want the chart to live.
Where Vizzlo is stronger
Vizzlo's library is the widest in this category - it advertises 120+ chart types, and the range goes well beyond standard business charts into Gantt variants, SWOT layouts, BCG matrices, business model canvases, and playful formats you won't find anywhere else. If your decks need that breadth, ChartKit doesn't compete on it. ChartKit covers the recurring management-deck set - waterfall, stacked bars, Mekko, line, and their relatives - and stops there.
Vizzlo is also the more multi-platform tool. It has a PowerPoint add-in alongside its Google Slides add-on, plus desktop apps for macOS and Windows, so a team split across PowerPoint and Slides can standardise on one charting tool. ChartKit is Google Workspace only. And with an established Workspace Marketplace listing (a 4.5 rating and 184K+ downloads on its own Slides page), Vizzlo has plenty of mileage on it.
If a polished Gantt matters today, Vizzlo also gets the point on availability - more on that below.
Where ChartKit is stronger
ChartKit's bet is that for recurring business decks, the workflow around the chart matters more than the size of the library.
- Charts live on the slide. You create, edit, and re-edit a ChartKit chart directly in the Slides editor - no separate app, no re-insert loop. With Vizzlo, the chart is built in Vizzlo's editor and brought into the deck through the sidebar. That's fine on day one and costs you on every update after.
- Live Google Sheets sync. Connect a ChartKit chart to a Sheets range once and it re-renders in the deck when the data changes (here's how the live connection works). Vizzlo advertises document auto-sync with cloud storage like Google Drive, Dropbox, and Box on paid plans - but updates flow through Vizzlo, not live on the slide, and a Google Sheets range connection isn't something its pages advertise at all.
- Storytelling controls for management decks. Totals, deltas, segment labels, annotations, and axis breaks are built into the chart itself, so the takeaway reads without hand-drawn text boxes layered on top.
- A free plan without a watermark. ChartKit's free tier is 10 charts a month, every chart type, no credit card. Vizzlo's free tier watermarks your charts, and its 14-day trial requires a card up front.
- Lower price for unlimited. ChartKit is €10/month or €80/year (about €7/month). Vizzlo Professional is $19/month, or $180/year (about $15/month), with team plans from $69/month for 5 seats.
The pattern is the same one we found comparing ChartKit against ChartBuddy - the differentiation in this category has moved from "which charts exist" to "what happens when the data changes".
Feature comparison
| ChartKit | Vizzlo | |
|---|---|---|
| Where you edit | Directly on the slide | Vizzlo's editor, insert via add-on |
| Platform | Google Slides, Docs, Sheets | Slides, PowerPoint, web, desktop apps |
| Chart library | Core business charts | 120+ types incl. frameworks |
| Waterfall / bridge charts | ✅ Native on slide | ✅ In Vizzlo's app |
| Mekko charts | ✅ Native on slide | ✅ In Vizzlo's app |
| Gantt charts | Rolling out | ✅ |
| Live Google Sheets sync | ✅ Auto re-render | Cloud-file sync via Vizzlo, paid tiers |
| Deltas, totals, axis breaks | ✅ | Varies by chart type |
| Free plan | 10 charts/mo, no watermark | Free with watermark |
| Trial | 14 days, no card | 14 days, card required |
| Price for unlimited | €10/mo (€80/yr) | $19/mo ($180/yr) |
Pricing and feature claims for Vizzlo come from vizzlo.com's own pages as of August 2026 - if you're reading this later, check their pricing page for current figures.
The workflow difference, concretely
Picture the Thursday-night data update before a Friday business review. The deck has a dozen charts and the numbers moved.
With ChartKit, charts connected to Sheets ranges have already re-rendered, and anything else is edited by clicking the chart on the slide - the data grid opens right there. With Vizzlo, you open the chart in Vizzlo's editor, update or re-sync the data, and push the result back through the add-on, chart by chart. Vizzlo's editor is genuinely pleasant to work in, which softens the loop but doesn't remove it.
That loop is invisible when you build a chart once for a one-off deck. It compounds when the same deck ships every week or month - which is exactly the deck consultants and finance teams live in. If your charts are built once and never updated, this whole section matters less, and Vizzlo's bigger library probably matters more.
Gantt charts, honestly
The one chart type worth calling out separately. Vizzlo has polished Gantt variants available today, built in its editor like everything else. ChartKit's on-slide Gantt and timeline workflow is built and rolling out, but it isn't enabled for everyone yet. If a Gantt is a hard requirement this week, Vizzlo (or ChartBuddy, which builds Gantts natively in Slides) is the safer pick. If your Gantt need is occasional and your recurring charts are waterfalls and stacked bars, weight the rest of the comparison more heavily.
So which should you choose?
Choose Vizzlo if you want the widest chart library in the category - including frameworks like SWOT and BCG matrices - if your team also works in PowerPoint, or if you need a polished Gantt today and don't mind the build-outside-insert-in workflow.
Choose ChartKit if your decks are recurring Google Slides business decks built on waterfalls, stacked bars, Mekkos, and line charts, and you want them edited on the slide and connected live to Google Sheets, at a lower price with a watermark-free free plan.
If you're weighing more than these two tools, our full Google Slides chart add-on roundup puts seven options in one table, and the think-cell alternatives guide covers the migration path if that's where you're coming from.
The honest test costs nothing on either side. ChartKit's free plan and Vizzlo's watermarked free tier both let you build your most-rebuilt chart and see which workflow survives a data update.
Download and try ChartKit for free — 10 charts a month on the Free plan, no card required.