
How to Make a Chart in Claude or ChatGPT (2026): From Chat to Google Slides
9 min read
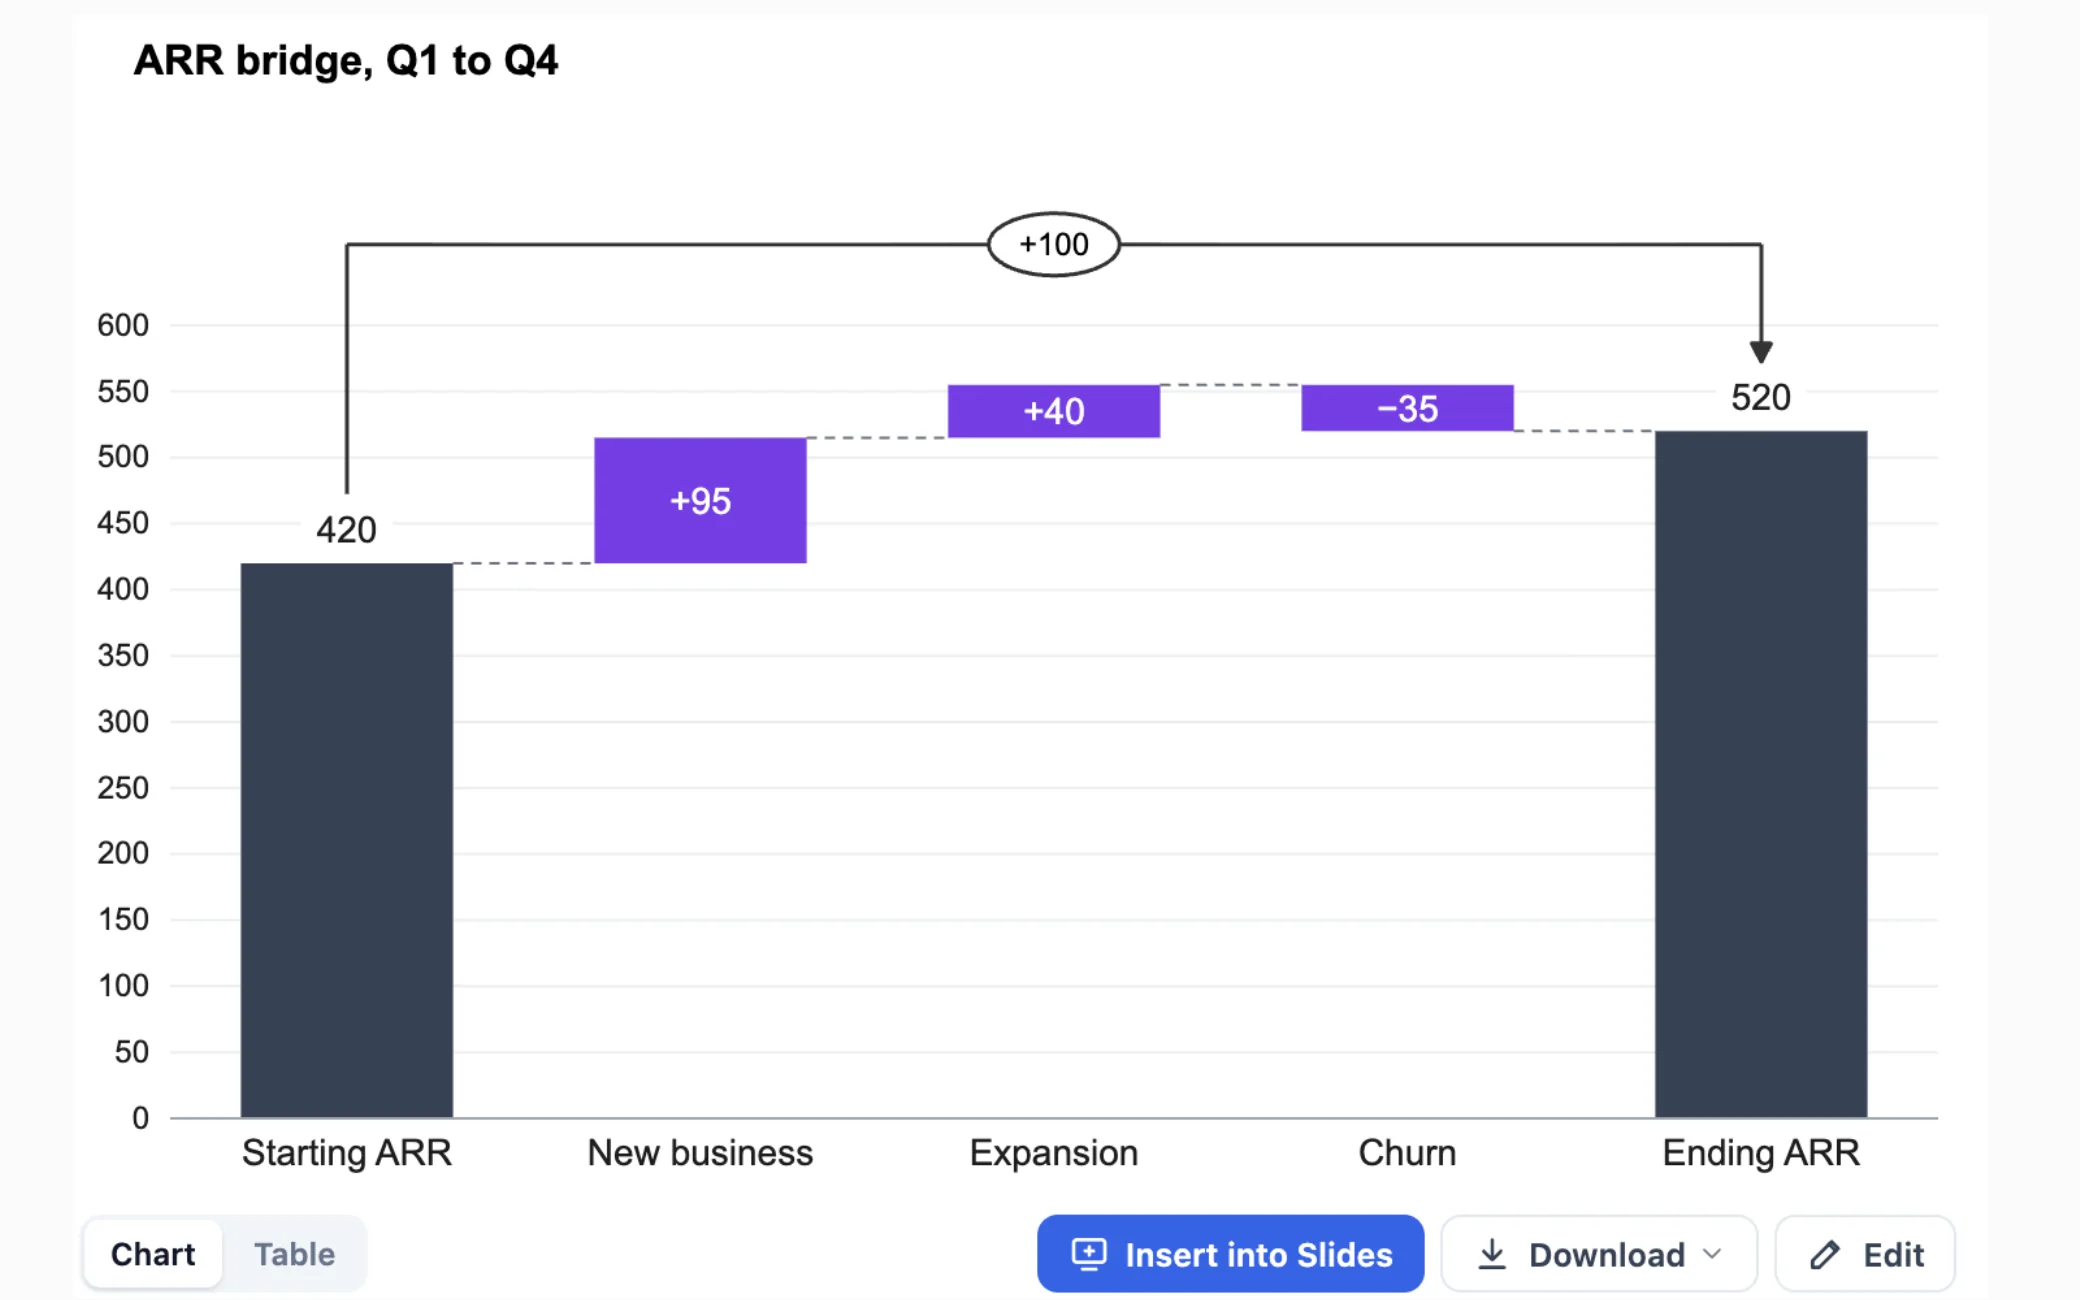
You paste a table into a chat with Claude or ChatGPT and ask for a chart. Something comes back, and it is fine for understanding the numbers. It is rarely something you can put in front of a client. The colors are the tool's defaults, the number formats are inconsistent, and changing one label means asking for the whole thing again.
Claude and ChatGPT can both draw a chart from your data. Getting one that looks like it belongs in a consulting or banking deck, and stays editable once it is on the slide, is a separate problem.
Connect ChartKit to Claude or ChatGPT. The connector is part of ChartKit Pro, and free users are offered a trial.
How to make a chart in Claude
There are three routes in Claude today, and they suit different jobs.
Paste the data and ask. For a small table, describe the chart you want and name the type. Claude's help center advises being explicit about the chart type, because "make a chart" leaves it guessing. This is the quickest way to see whether a trend or a split is worth a slide.
Upload a file. Claude can analyse and visualise data from an uploaded CSV, as long as the file fits in the conversation's context. It reads the file, does the arithmetic with code, and can show the result as an artifact you can interact with. Use this when the numbers are too large to paste or when you want Claude to compute the figures before charting them.
Ask for an artifact. Claude can build a chart as an artifact, a small web page it writes with chart code, so you can adjust it by asking. This works well for exploration. The chart is code Claude wrote for this chat, so it carries that chat's styling choices, and it lives in the chat rather than in your deck.
How to make a chart in ChatGPT
Paste or upload. OpenAI's help center says ChatGPT can work with spreadsheet files such as .xlsx and .csv, and that it can produce tables or charts when a structured view helps. Clear column names and one record per row give better results. Which file types you can upload depends on your plan and model.
Name the chart. As with Claude, say which type you want and what should be on each axis. ChatGPT runs code on the data and shows the chart in the conversation.
Get it out. The usual route is to download the image and place it on a slide. At that point it is a picture, so a changed number means asking for a new image and placing it again.
Where built-in charts fall short for a deck
Both tools are good at exploring. A deck asks for more.
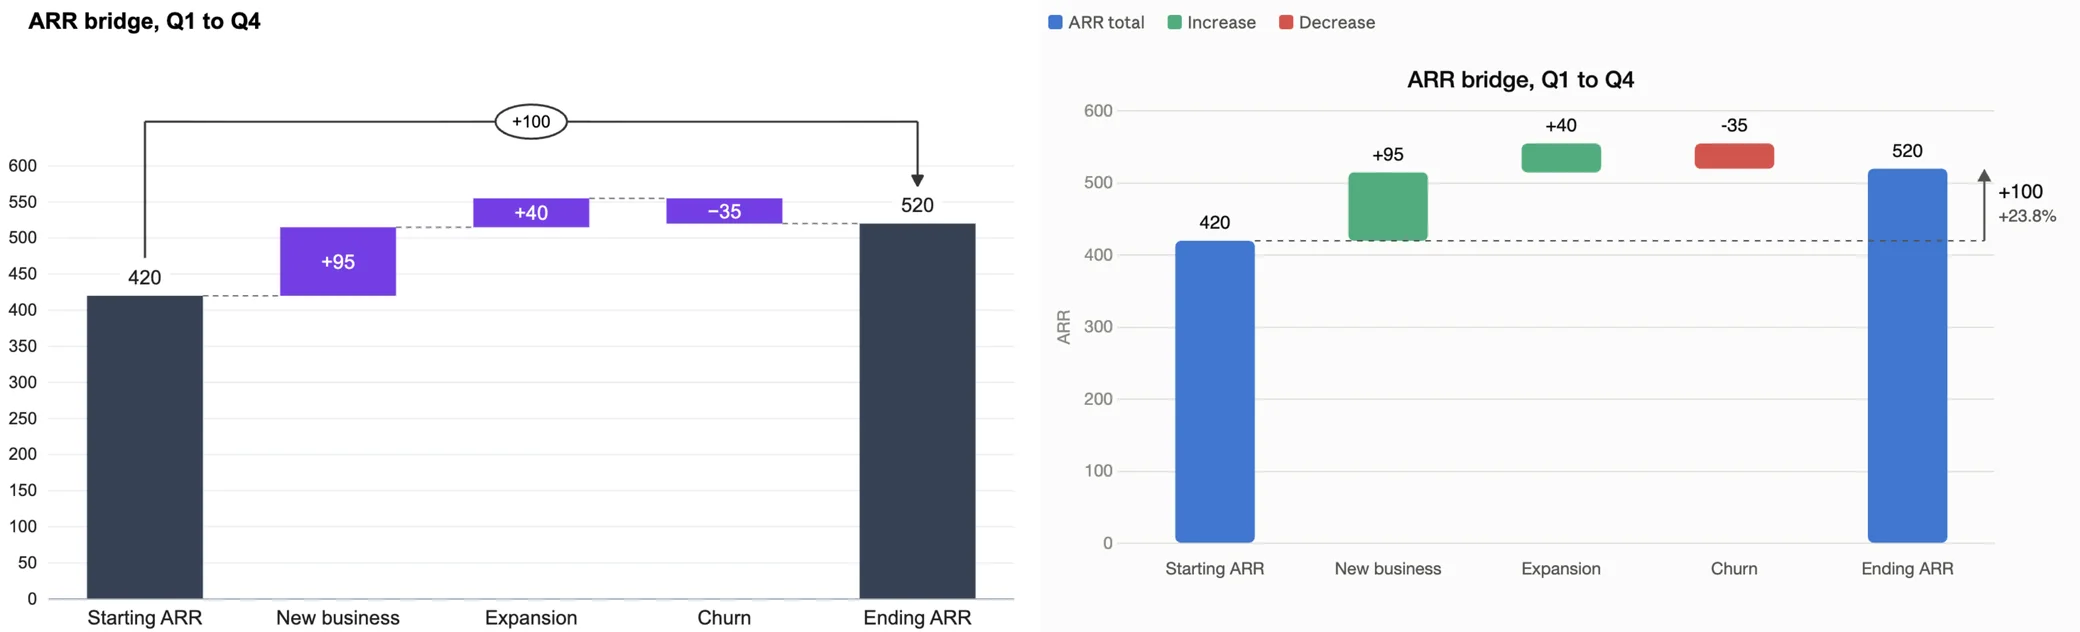
Same data and prompt. Left is ChartKit, right is Claude's own inline chart. Claude's chart is clean and does the job in the conversation. The differences are that ChartKit uses your saved brand palette and draws a think-cell-style delta bracket, and the chart has an editable model behind it with a route into Slides.
- The chart should use your firm's colors, not a library default.
- Labelled bars usually carry no value axis, and one number format applies across the chart.
- Waterfalls, mekkos and 100% stacked bars are the types a finance or consulting deck runs on, and Google Slides does not draw them either.
- The chart should be editable on the slide, so a late number change is a two-minute fix.
If you build the chart once for a quick look, the built-in route is enough. If the chart is going into a deck that gets updated, it is worth routing it through something that treats it as a chart and not as an image. For the manual route, see our guide on how to create charts in Google Slides.
Connect ChartKit to Claude or ChatGPT
ChartKit runs an MCP server, the standard way Claude, ChatGPT and other AI apps call an outside tool during a conversation. Once it is connected, you ask for a chart in plain language.
In Claude: open Settings, go to Connectors, and add a custom connector. Name it ChartKit and paste https://www.getchartkit.app/mcp. Click Connect and sign in with the Google account you use in the extension. Claude Desktop shares connectors with claude.ai, so you only do this once. In Claude Code, run claude mcp add --transport http chartkit https://www.getchartkit.app/mcp, then /mcp and authenticate.
In ChatGPT: custom connectors sit behind Developer mode, which OpenAI limits to certain paid and workspace plans, and the menu path has changed over time, so check OpenAI's current guide for your plan. Create a connector named ChartKit, paste the same URL, and choose OAuth. Then pick ChartKit from the tools menu in a chat and sign in. In Codex, run codex mcp add chartkit --url https://www.getchartkit.app/mcp followed by codex mcp login chartkit.
It is one Google sign-in, with the same account and saved brand palette as the extension.
One practical tip. claude.ai often answers a plain chart request with its own chart. Say "use ChartKit" in the prompt to send the request to the connector. In our own tests, three plain chart requests without that phrase all got Claude's built-in chart.
What the connector can do
The connector gives Claude or ChatGPT a small set of tools, and you do not call them by name. You describe what you want.
- Draw a chart.
visualize_data(also available ascreate_chart) draws a chart from your data in the same engine as the extension, in your saved palette, in consulting-deck style. - Change it.
update_chartchanges the numbers, chart type, sorting, highlight or text of an existing chart. - Put it on a slide.
list_open_decksfinds the Google Slides decks you have open, andinsert_chart_into_slidesadds the chart to the slide you are on. - Embed it in an artifact.
get_live_chart_embedreturns a page for a Claude artifact that renders the chart and stays current when the chart changes.
Under each chart in the chat there are buttons to insert it into Slides, download it and edit it.
A worked example
Say you are talking through a client's ARR and you paste this table.
| Stage | Value |
|---|---|
| Starting ARR | 420 |
| New business | 95 |
| Expansion | 40 |
| Churn | -35 |
| Ending ARR | 520 |
You ask, "Make a waterfall chart from this table and add a delta from Starting ARR to Ending ARR. Put it in my open deck."
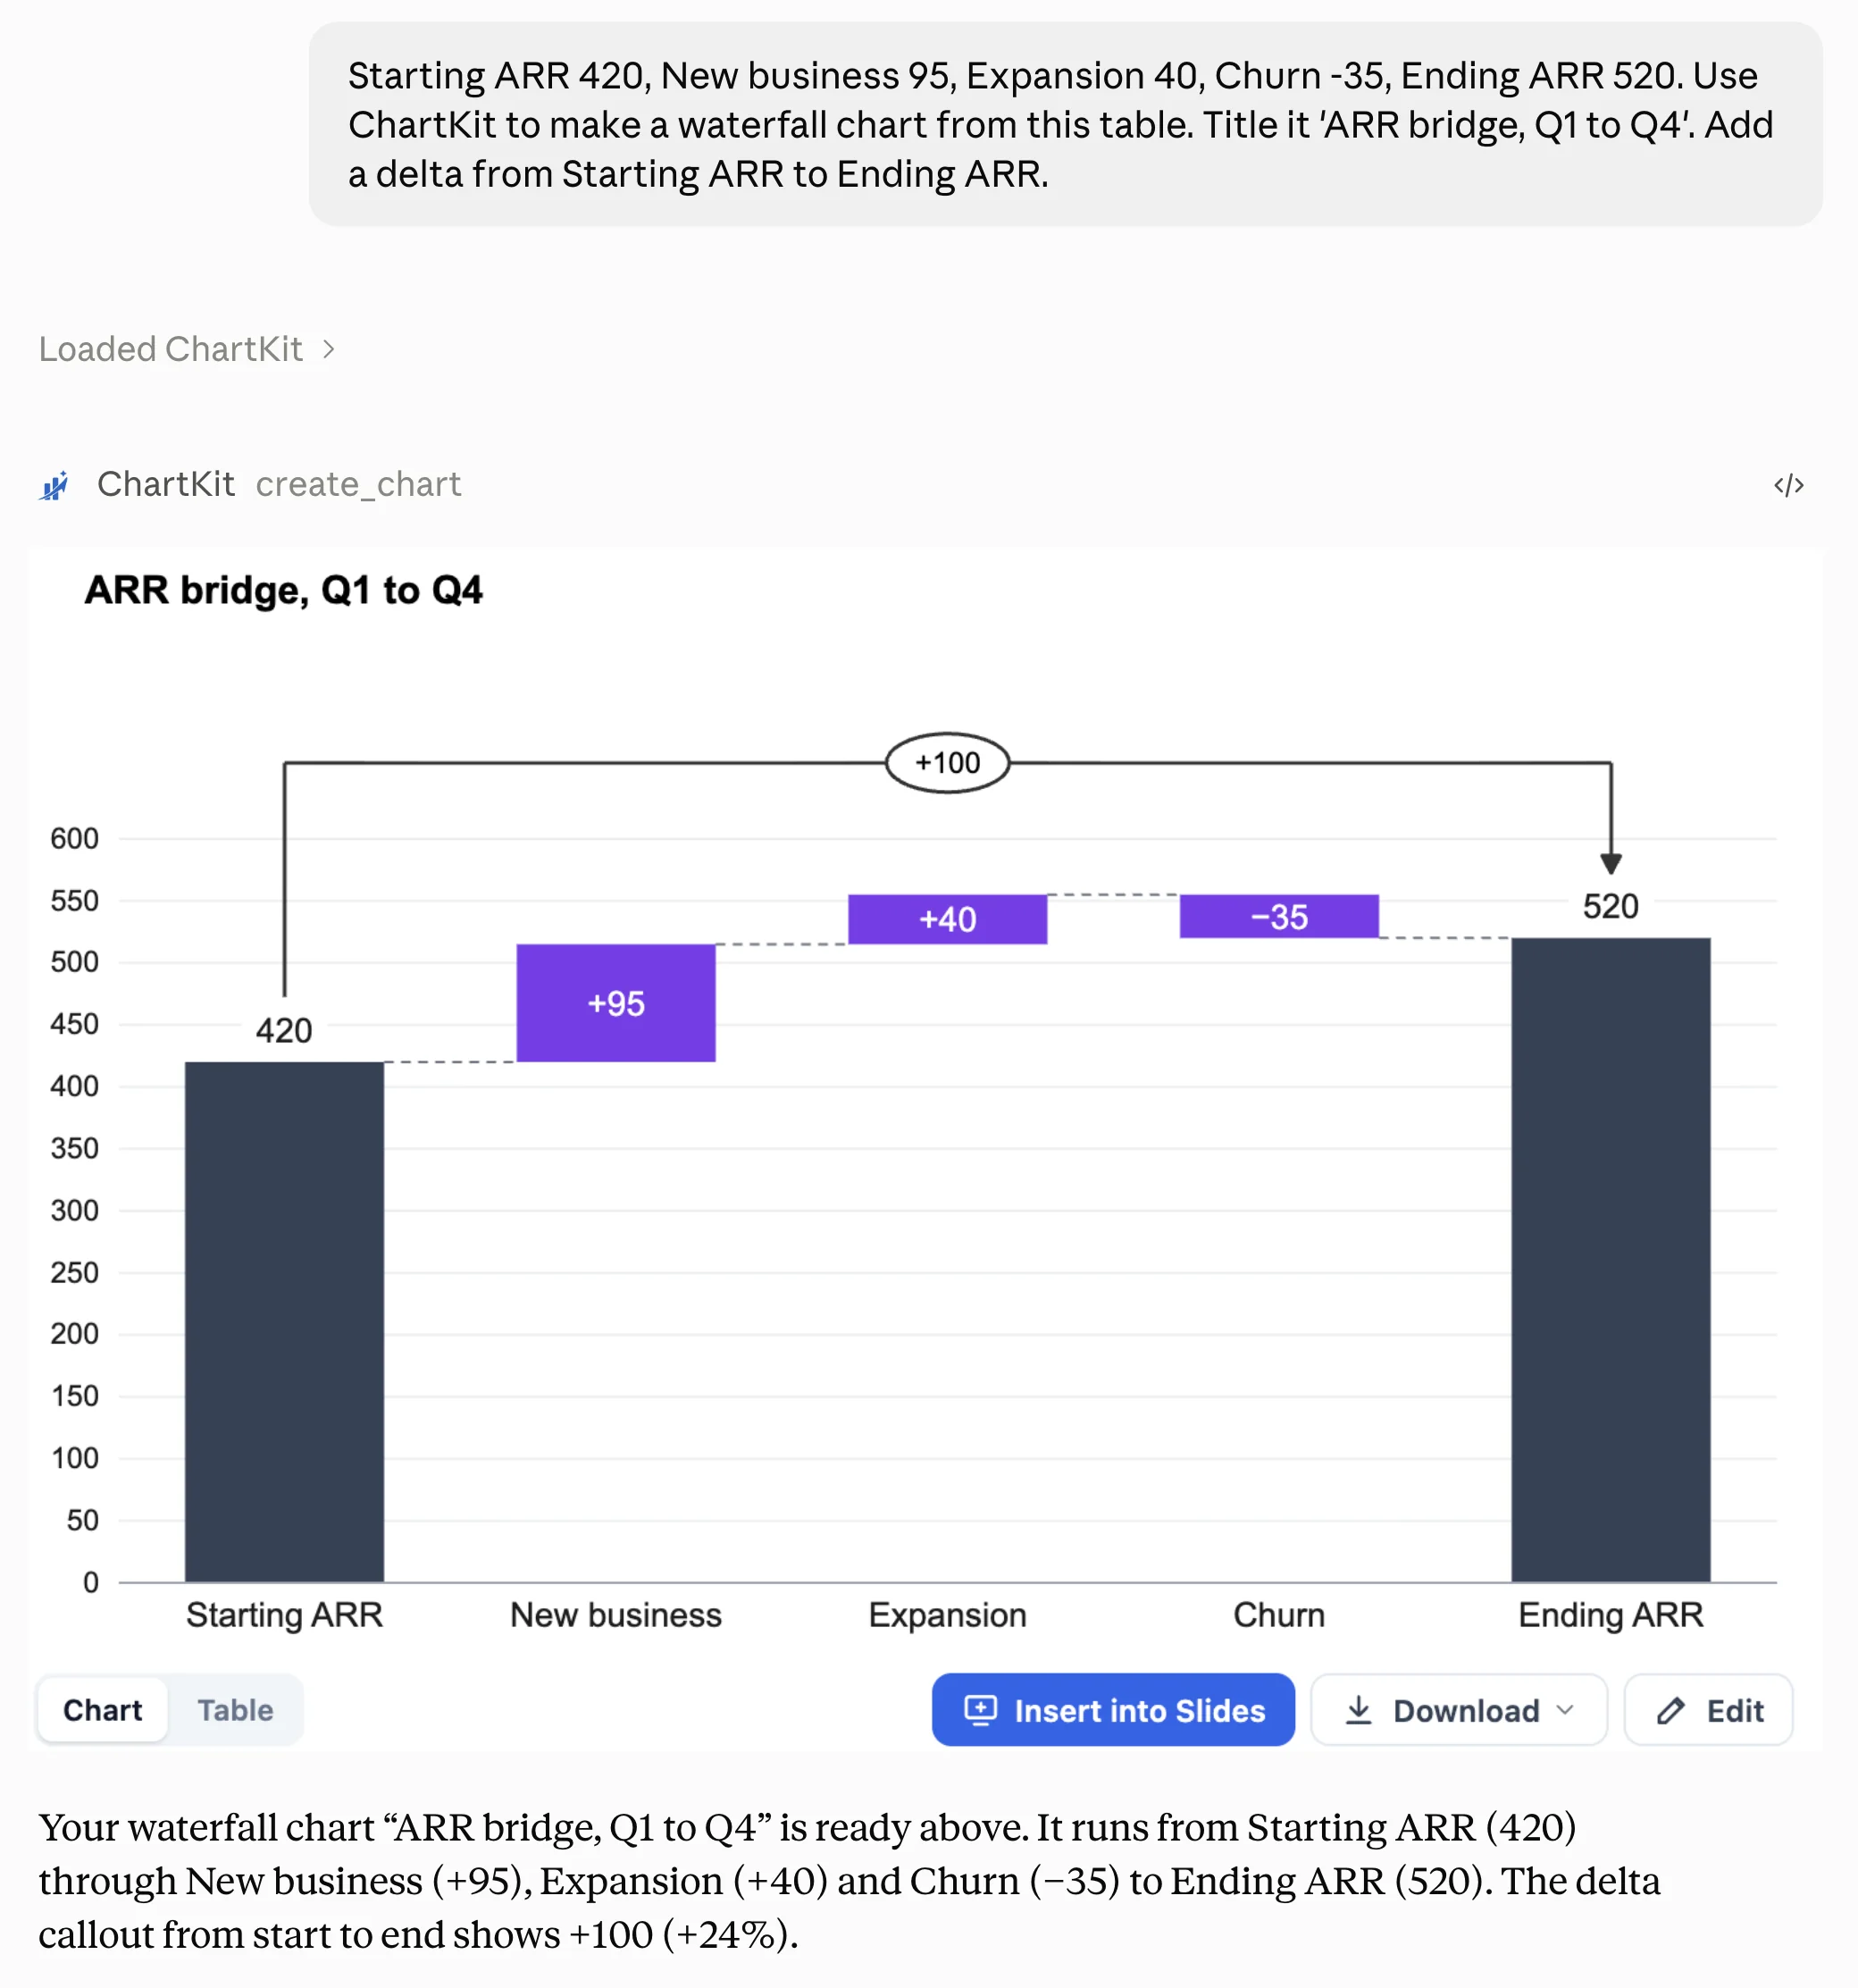
The chart appears in the chat with the delta drawn for you, then Claude adds it to the slide you have open. You did not specify colors, number format or legend position. The result follows the extension's conventions, with signed steps on the waterfall and one number format across the chart. If the churn number changes tomorrow, you tell Claude and the chart on the slide is refreshed. For more on this chart type, see how to make a waterfall chart in Google Slides.
What to know before you use it
The connector is part of ChartKit Pro. On the free plan the chat tells you so and offers a free Pro trial, and nothing is created. The ChartKit extension needs to be installed and signed in to the same Google account, and the target deck needs to be open in Slides, for the insert step to work.
If you only need a quick look at the data, Claude's or ChatGPT's own chart is faster and needs no setup. ChartKit is for the chart that ends up in the deck. If you are weighing that against other tools, the Think-cell alternative for Google Slides comparison covers the wider picture.
Connect ChartKit takes a minute. If you have not used ChartKit at all, start with the extension.
FAQ
How do I make a chart in Claude?
Paste your data or upload a CSV and ask for the chart type you want. Claude can analyse the file and draw the chart as an artifact you can interact with. For a chart that goes into a slide deck, connect the ChartKit connector and Claude draws it in ChartKit's engine instead.
How do I make a chart in ChatGPT?
Upload a CSV or Excel file, or paste a table, and ask for a specific chart. ChatGPT's data analysis runs code on the file and shows the chart in the conversation. To get an editable chart for Google Slides, add ChartKit as a connector, which needs a ChatGPT plan that allows custom connectors.
Can Claude make charts?
Yes. It can analyse an uploaded file and build a chart as an artifact, usually with code. It is good for exploring data. A chart for a deck usually needs its own palette, number formats and labelling, which you would otherwise ask for by hand.
Can ChatGPT make charts for Google Slides?
It can make a chart from your data, but getting it into Slides means downloading an image and placing it as a picture. With the ChartKit connector, ChatGPT draws the chart in ChartKit's engine and the chart can be inserted into an open Slides deck.
Does ChartKit insert the chart into my Google Slides deck?
Yes. Ask for the chart in your deck and Claude lists your open decks and adds it to the slide you are on. This needs the ChartKit extension signed in with the same Google account, and the deck open in Slides.
Can I change the chart after it is inserted?
Yes. Ask Claude to change the numbers, chart type, sorting or highlight and the chart on the slide is refreshed. You can also open it in the extension and edit it by hand.
Is there an MCP for charts?
Yes, at https://www.getchartkit.app/mcp. Connect it to Claude, ChatGPT, Claude Code or Codex and ask for a chart in plain language.
Is the ChartKit connector free?
The connector is part of ChartKit Pro. If you are on the free plan, the chat points you to a free Pro trial. The extension itself has its own free plan.