Reporting
Management reporting charts in Google Slides
Management reporting charts have a different job than one-off analysis charts. They need to make recurring performance questions easier to answer.
Quick answer
Build a small set of repeatable chart patterns for management reporting. Use line charts for trends, waterfalls for movement, stacked bars for mix, and simple bars for comparisons. Keep the same visual rules from one reporting cycle to the next.
Reporting system
The best reporting decks reuse the same chart logic
A management team should not have to relearn the chart style every month. If revenue mix, pipeline movement, churn, headcount, and margin are reviewed repeatedly, the deck should use stable chart patterns for those questions.
Consistency helps the audience spend less energy decoding the slide and more energy discussing the decision. That is why a chart library for management reporting is often more valuable than a collection of one-off visuals.
Core chart types
Four chart patterns cover most recurring reporting needs
Line charts
Use them for trend, plan versus actual, and time-based movement.
Waterfall charts
Use them when the team needs to understand the drivers from one total to another.
Stacked bars
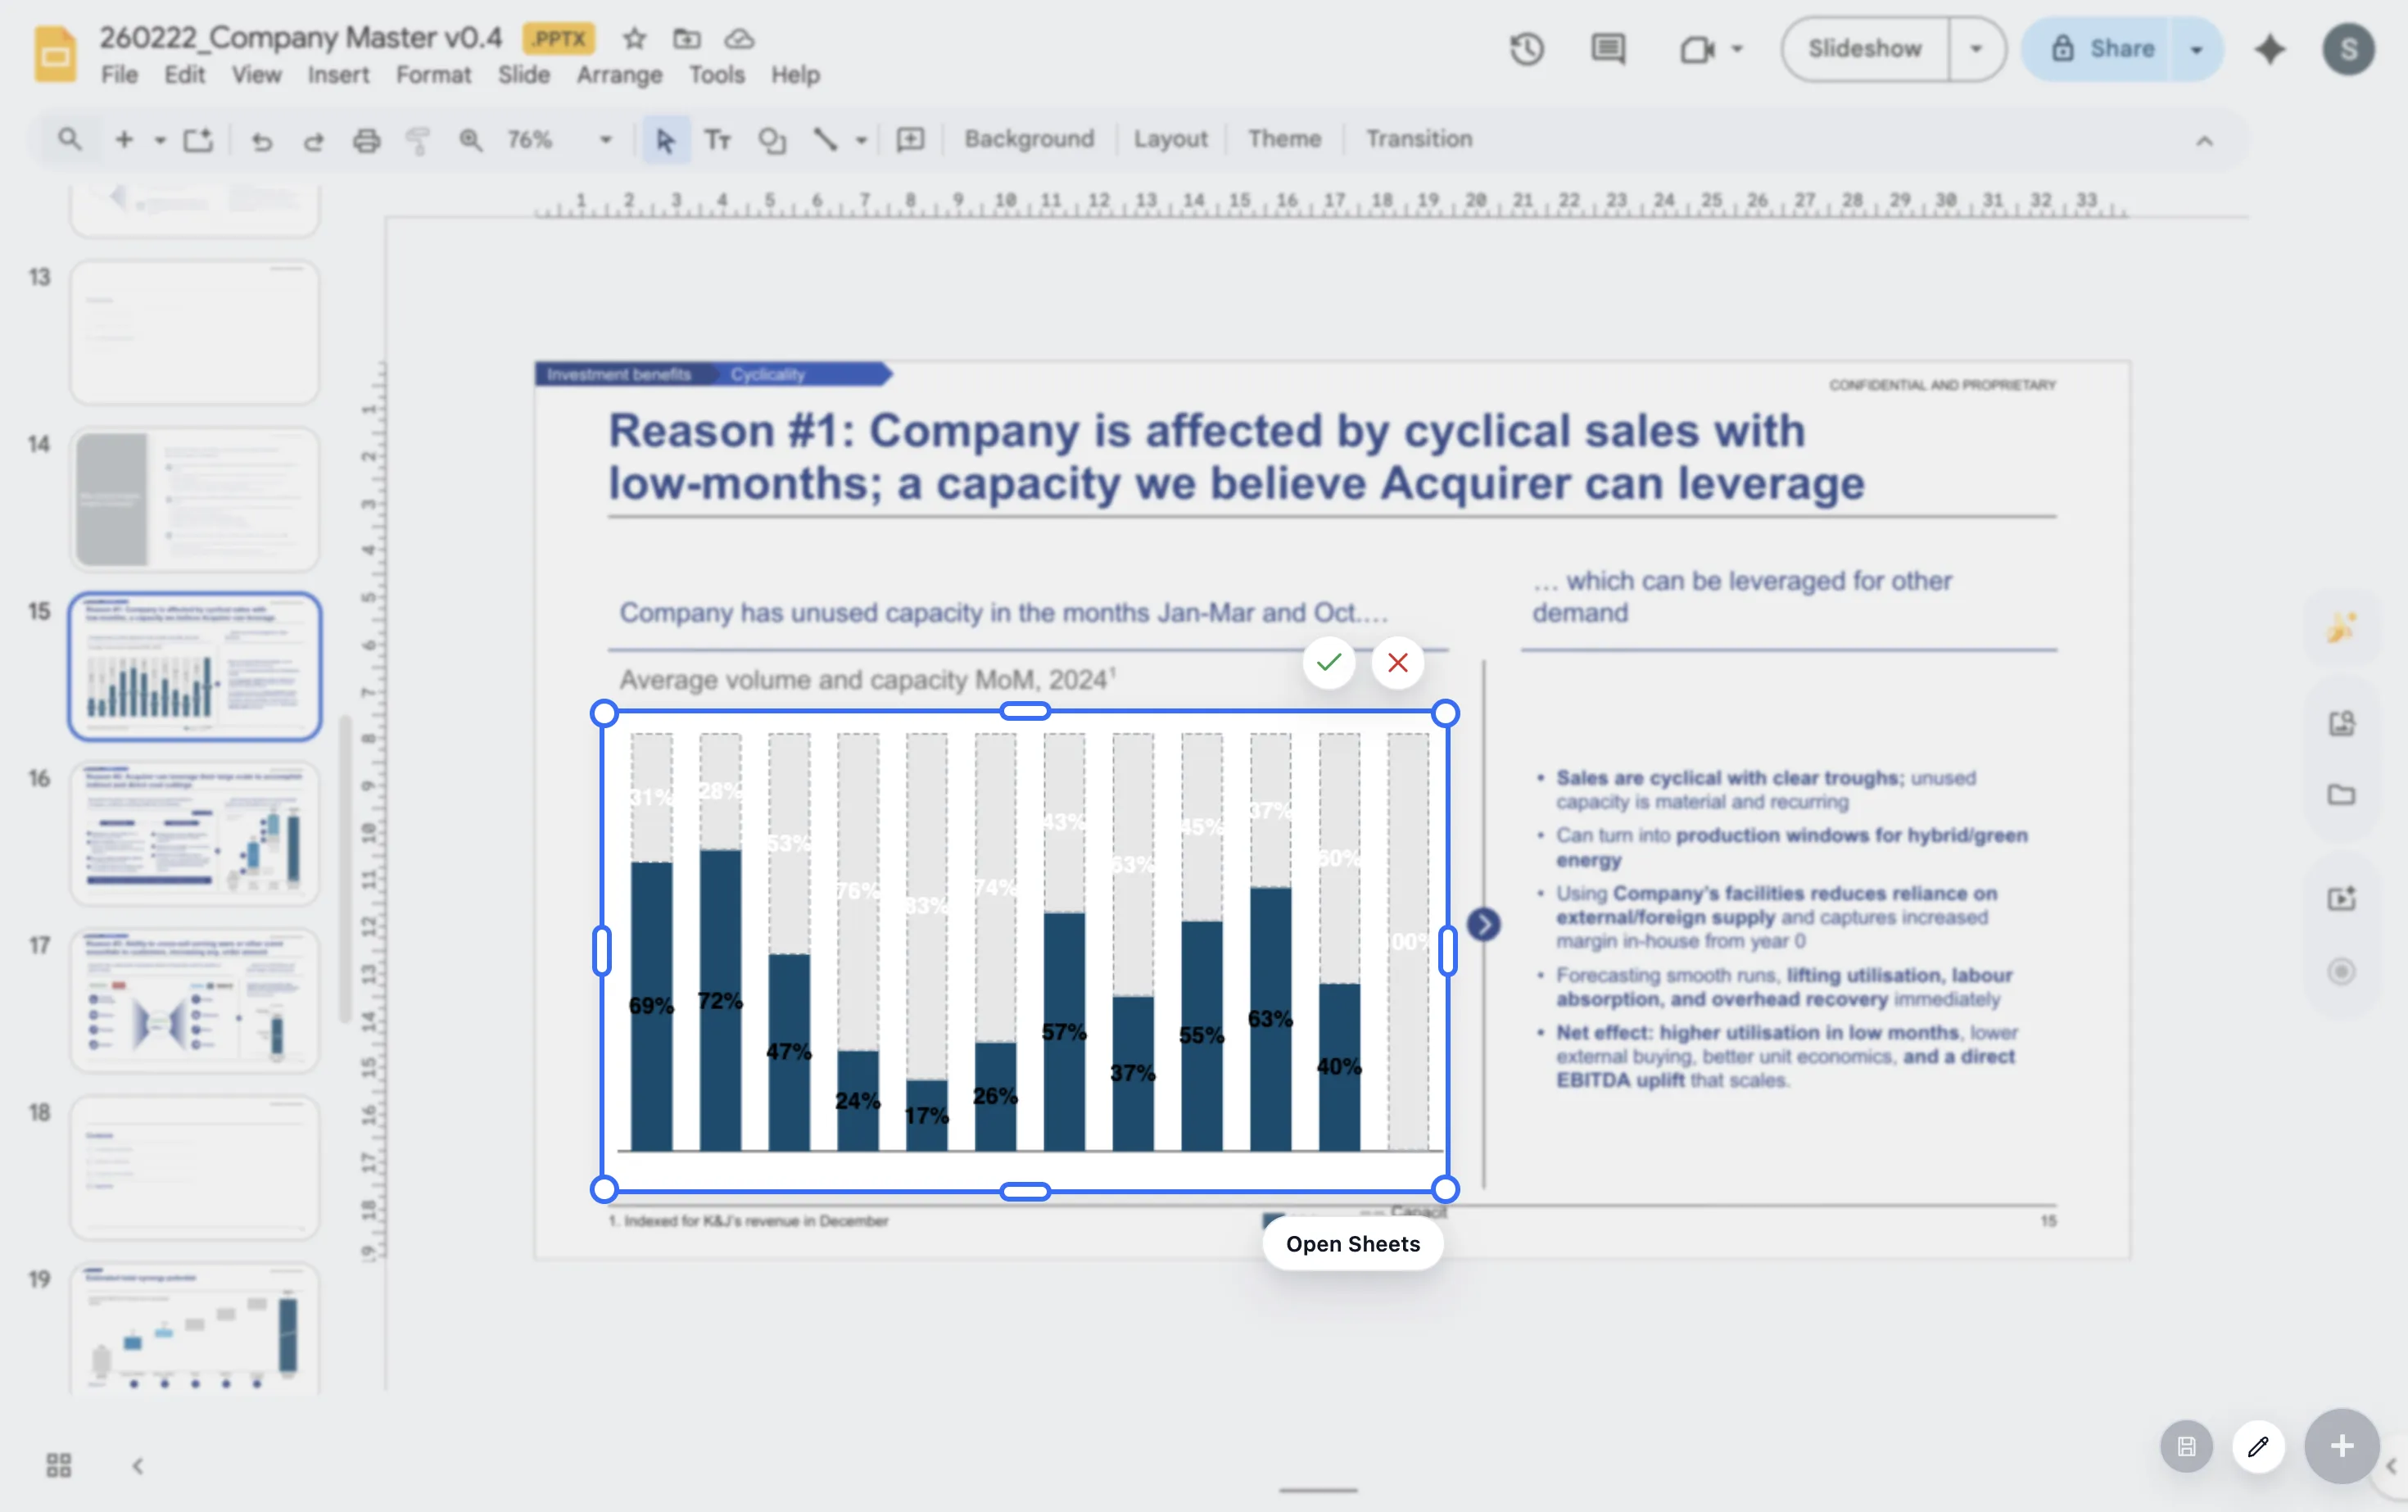
Use them when total size and mix both matter to the decision.
Lead magnet
Monthly reporting chart pack checklist
Use this checklist to define the repeatable chart pack for a monthly management deck.
- Which questions appear in every meeting?
- Which chart type answers each recurring question most clearly?
- Which labels, totals, and deltas should stay consistent every month?
- Which charts need a short note explaining why performance moved?
Standardize reporting charts for the team
If several people build the same recurring deck, ChartKit can help create a more consistent Google Workspace workflow.
Where ChartKit fits
Keep recurring chart updates inside Google Workspace
ChartKit is useful when teams build recurring charts in Google Slides, Docs, and Sheets. The workflow is strongest when the same chart is updated repeatedly and needs to stay presentation-ready.
For management reporting, that means teams can focus on the story for the month rather than rebuilding the chart format each time.
FAQ
Common questions about management reporting charts
What is the best chart type for management reporting?
There is no single best chart type. Use the chart that matches the question. Trends need lines, bridges need waterfalls, and mix questions often need stacked bars.
How many charts should a management deck include?
Use enough charts to answer the recurring questions, but avoid adding charts that do not lead to a decision or discussion.
Why should reporting charts stay consistent?
Consistency lets the audience compare periods faster. The team can focus on what changed rather than how the chart works.