Reporting
Monthly business review chart examples
A monthly business review should help the team understand performance, drivers, risks, and actions. The charts should support that rhythm.
Quick answer
A strong MBR chart pack usually includes trend charts, variance charts, driver bridges, segment mix charts, and action-oriented summary slides. Reuse the same chart patterns so each month becomes easier to read.
MBR structure
Recurring meetings need recurring chart patterns
The value of an MBR is not novelty. It is a consistent read on the business. If every month uses a different chart style, the audience spends too much time decoding the deck.
Use the same patterns for the same questions. That gives the team a shared language for performance, variance, pipeline, cost, and next steps.
Examples
Three chart examples belong in many MBR decks
Revenue trend
Use a line chart to show performance over time against plan or prior year.
Variance bridge
Use a waterfall to explain why the month landed above or below expectations.
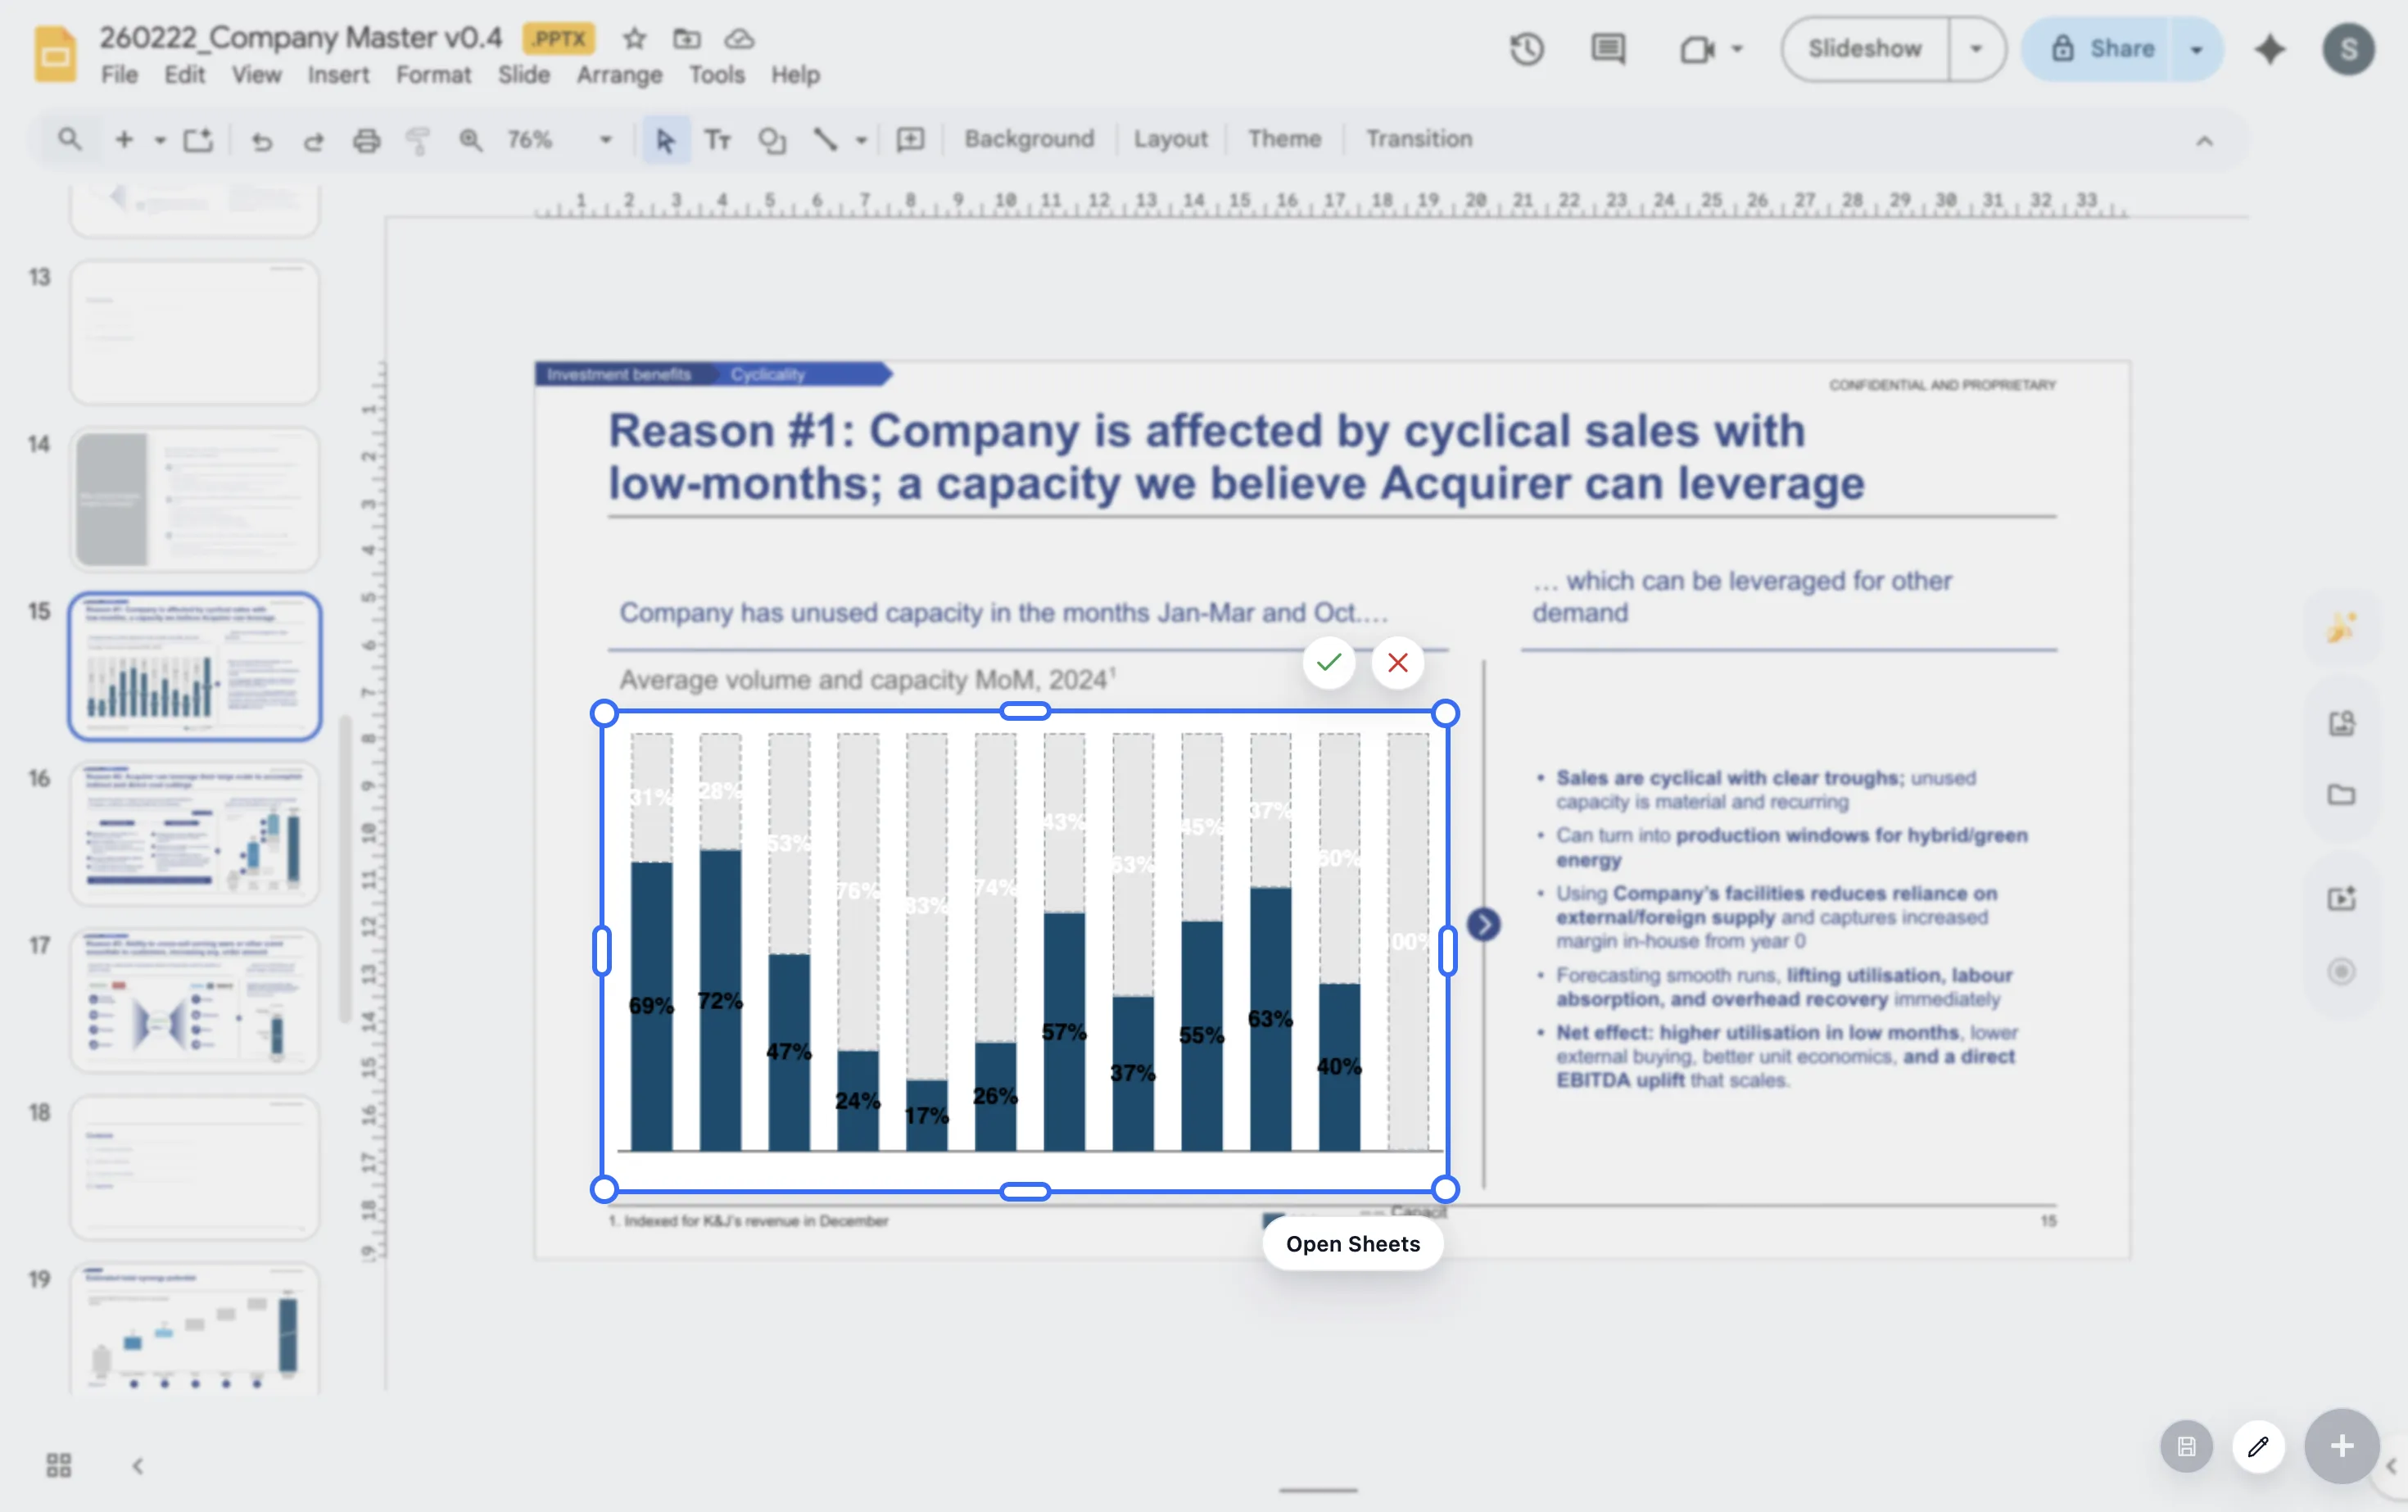
Segment mix
Use stacked bars to show how customer, product, or channel mix changed.
Lead magnet
MBR chart planning checklist
Use this checklist when planning or cleaning up a monthly business review deck.
- List the questions leadership asks every month.
- Assign one repeatable chart pattern to each recurring question.
- Separate performance charts from driver charts.
- Reserve space for actions, owners, and decisions after the charts.
Make the next review easier to update
ChartKit helps teams standardize chart creation for recurring Google Slides reporting.
Where ChartKit fits
Build and update recurring MBR charts in Google Slides
ChartKit is built for teams that update presentation-ready charts repeatedly in Google Workspace. That makes it useful for MBR decks where the same chart families return every cycle.
The practical gain is consistency. The deck can improve over time instead of being rebuilt from scratch each month.
FAQ
Common questions about MBR chart examples
How many charts should an MBR include?
Include enough charts to answer the recurring questions. If a chart does not lead to a decision, action, or useful discussion, remove it.
Should an MBR use the same charts every month?
Often yes. Stable chart patterns make trends and changes easier to understand across reporting cycles.
What is the difference between an MBR and a dashboard?
A dashboard monitors many metrics. An MBR deck should explain the most important movements and guide discussion.