Chart design
How to make charts in Google Slides look professional
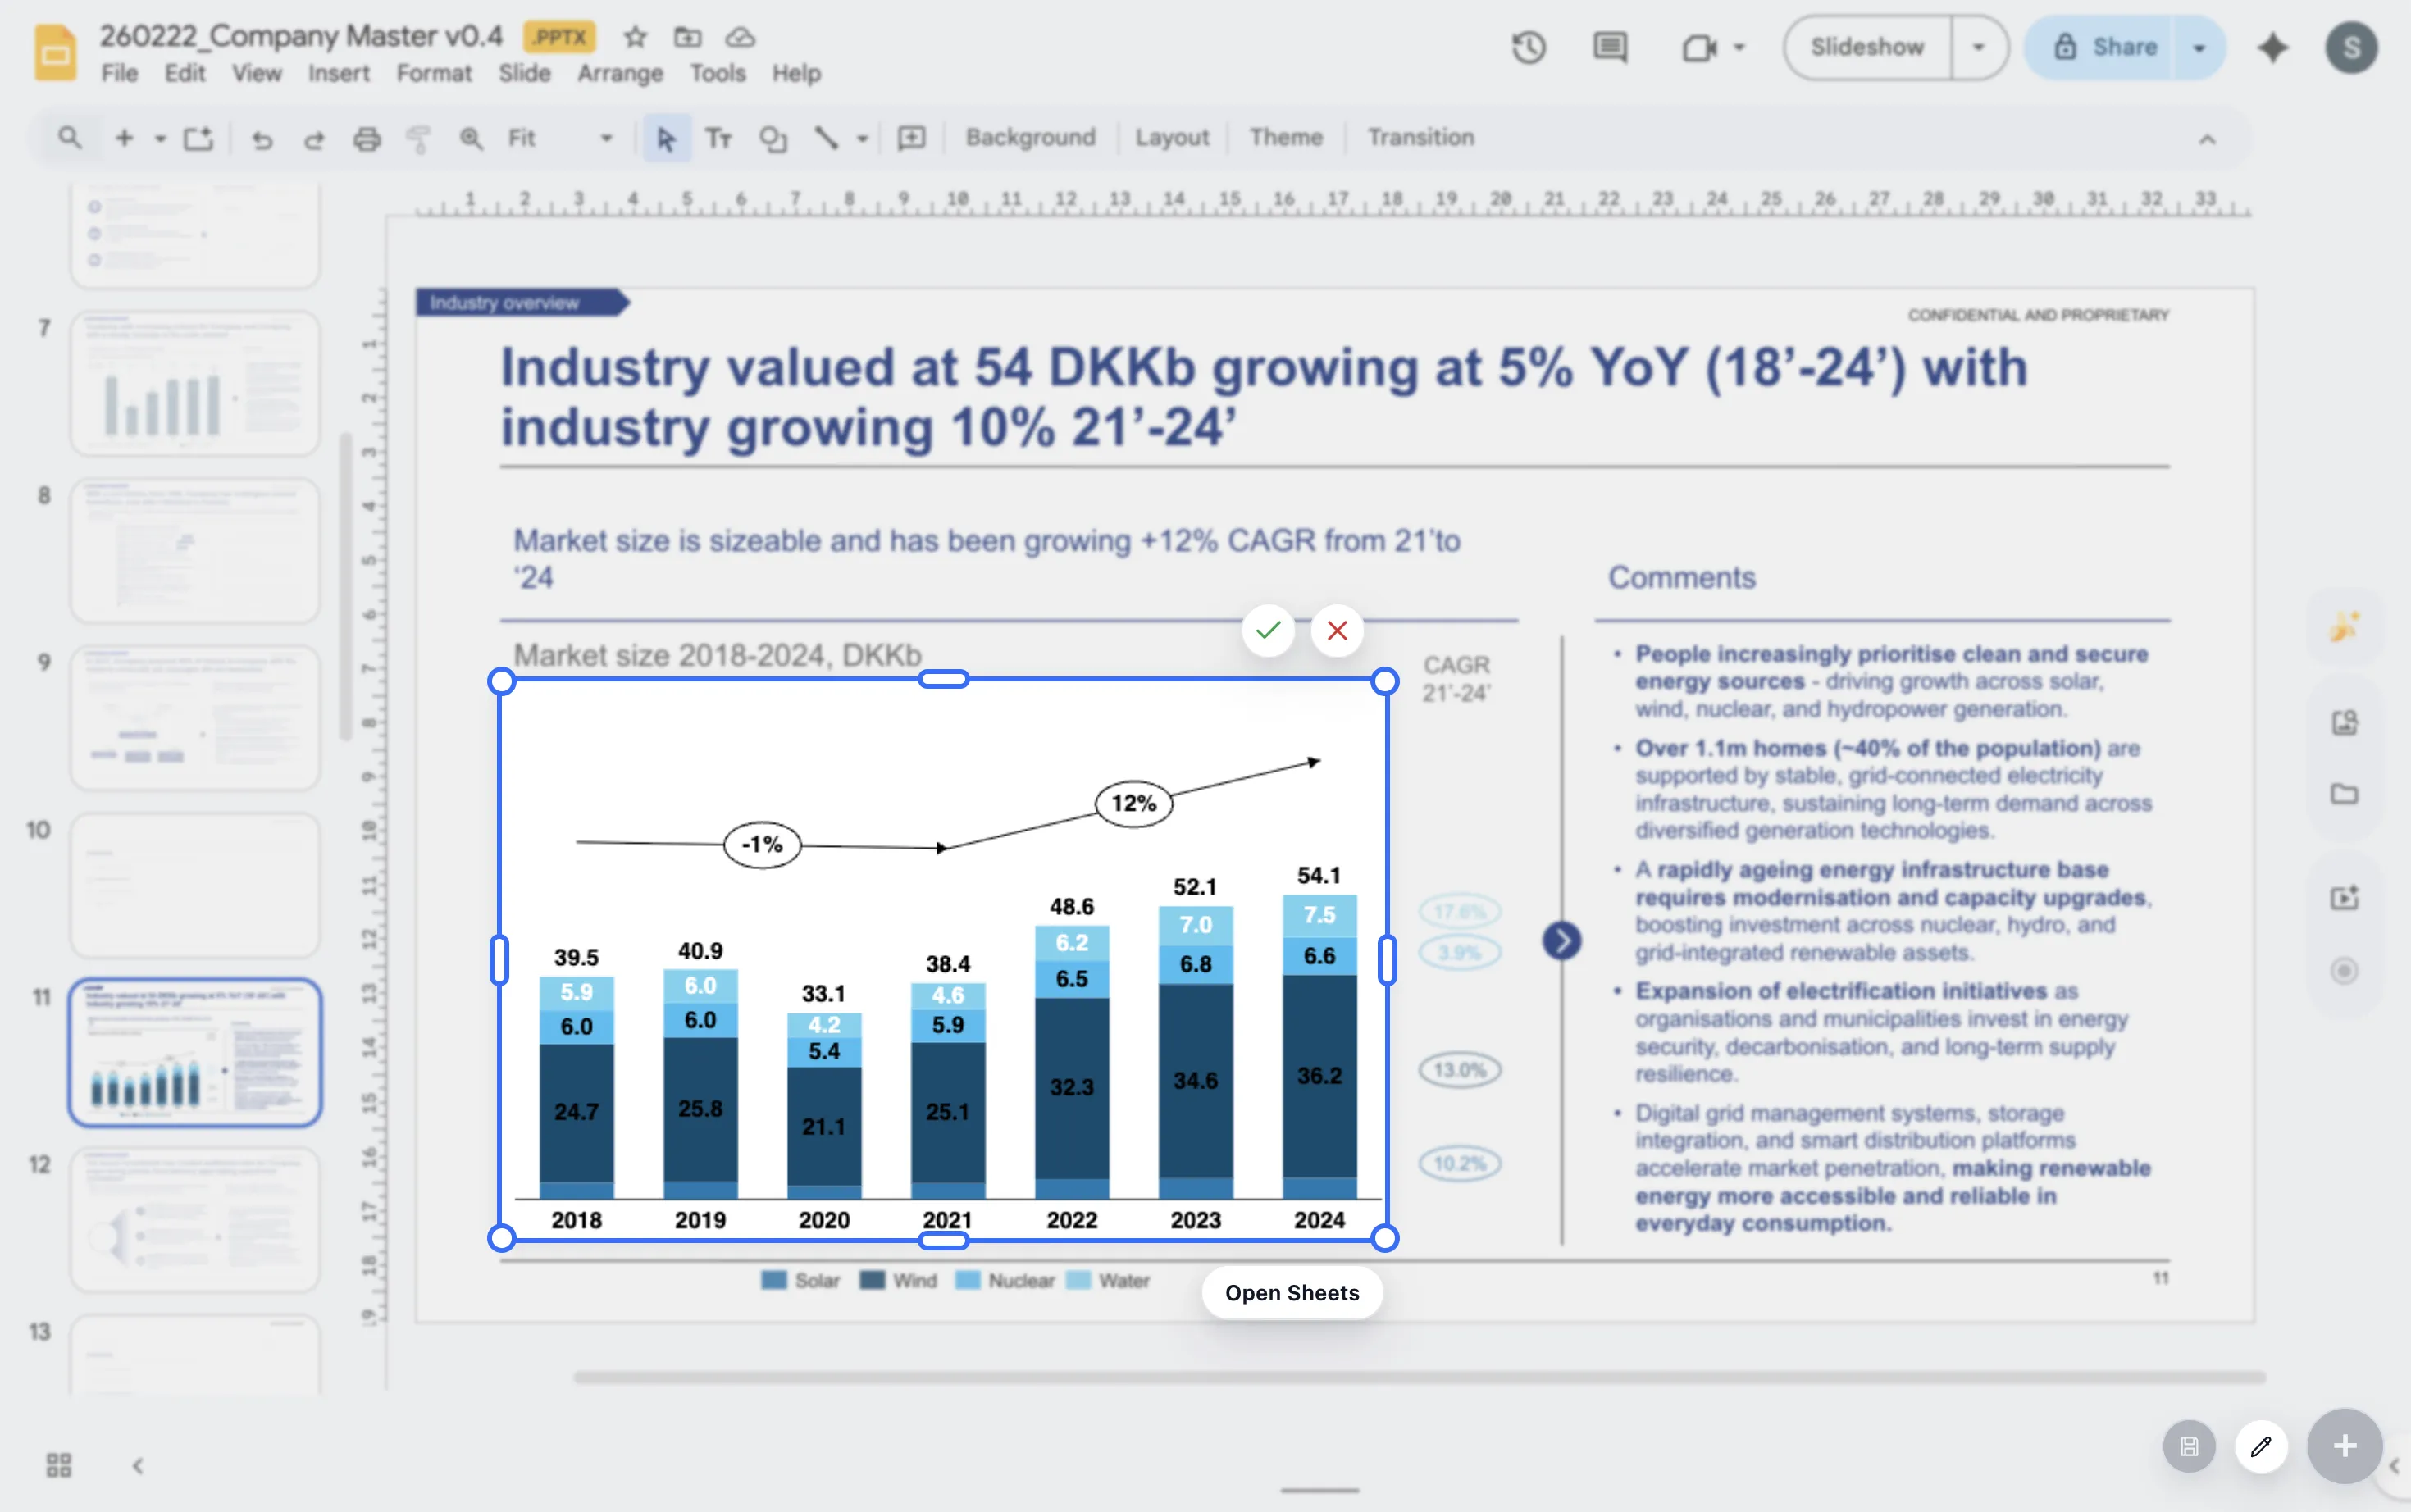
A professional chart in Google Slides is not a decorated spreadsheet chart. It is a visual argument that helps the audience understand the point quickly.
Quick answer
Start by writing the takeaway in one sentence, then remove every chart element that does not help that sentence. Use consistent colors, readable labels, clear totals, and enough spacing for the chart to survive in presentation mode.
Core idea
A professional chart is built around one decision
Most weak slide charts fail because they try to show everything. The viewer has to read the title, decode the axes, compare the values, and guess what matters. A better chart makes one decision easier. It might show which region is growing fastest, which cost line caused the margin drop, or where the forecast changed.
Before changing colors or labels, write the decision the chart should support. If the sentence is unclear, the chart will be unclear too. Once the point is clear, design choices become easier because each choice has a job.
Presentation checks
Three details usually separate clean charts from rough ones
One clear headline
Use the title to state the takeaway, not just the chart type. A title like Net revenue grew despite lower enterprise mix does more work than Revenue by segment.
Labels with restraint
Label the values that matter to the story. When every bar, point, and segment shouts at once, the important number becomes harder to find.
Spacing that survives projection
A chart can look acceptable while editing and still fail in a meeting room. Leave enough room around labels, legends, and totals.
Lead magnet
Slide chart QA checklist
Use this checklist before sending a deck or walking into a meeting. It works for stacked bars, line charts, waterfalls, and simple comparison charts.
- Can the audience state the main takeaway after five seconds?
- Does every label support the story rather than repeat obvious values?
- Are colors used consistently across the whole deck?
- Would the chart still read clearly on a smaller screen or projector?
Use the checklist inside your next chart workflow
If these checks describe the work you repeat every week, ChartKit is built to keep that polish close to Google Slides.
Where ChartKit fits
Keep the chart close to the slide while you polish it
ChartKit helps because the chart workflow stays inside Google Workspace. You can build the chart, adjust labels, add deltas, and refine the spacing while looking at the slide it belongs on.
In other words, you are not polishing a chart in isolation and hoping it still works once it lands in the deck. You can judge the chart in the same context where the audience will see it.
FAQ
Common questions about professional Google Slides charts
What makes a Google Slides chart look unprofessional?
The most common issues are unclear titles, too many labels, inconsistent colors, cramped spacing, and charts pasted as screenshots that no longer match the deck style.
Should every chart have data labels?
No. Use labels when exact values matter. If the point is a broad pattern, a simpler axis or a few selective labels often work better.
Can ChartKit help with chart polish?
Yes. ChartKit is designed for presentation-ready charts in Google Workspace, with controls for labels, totals, deltas, annotations, and spacing.