Board decks
Board deck charts in Google Slides
A board deck chart should not make directors search for the point. It should show the pattern, the gap, or the decision clearly enough that the conversation can move forward.
Quick answer
Use board deck charts to explain performance against plan, key changes since the last meeting, and the decisions management wants support on. Keep each chart tied to one question and avoid dense dashboards on single slides.
Board context
Board charts should support a discussion, not replace it
The board does not need every metric at the same level of detail. It needs a clear read on what changed, what matters, and where management needs input. That is a different standard from an internal operating dashboard.
A strong board chart usually has a clear headline, a small number of meaningful labels, and enough context to understand whether the result is good, bad, or worth watching.
Board questions
Three chart jobs appear in most board decks
Explain performance
Use line charts and bars to show whether the company is ahead, behind, or tracking plan.
Explain movement
Use waterfalls when the board needs to understand what drove the change from one period to the next.
Explain mix
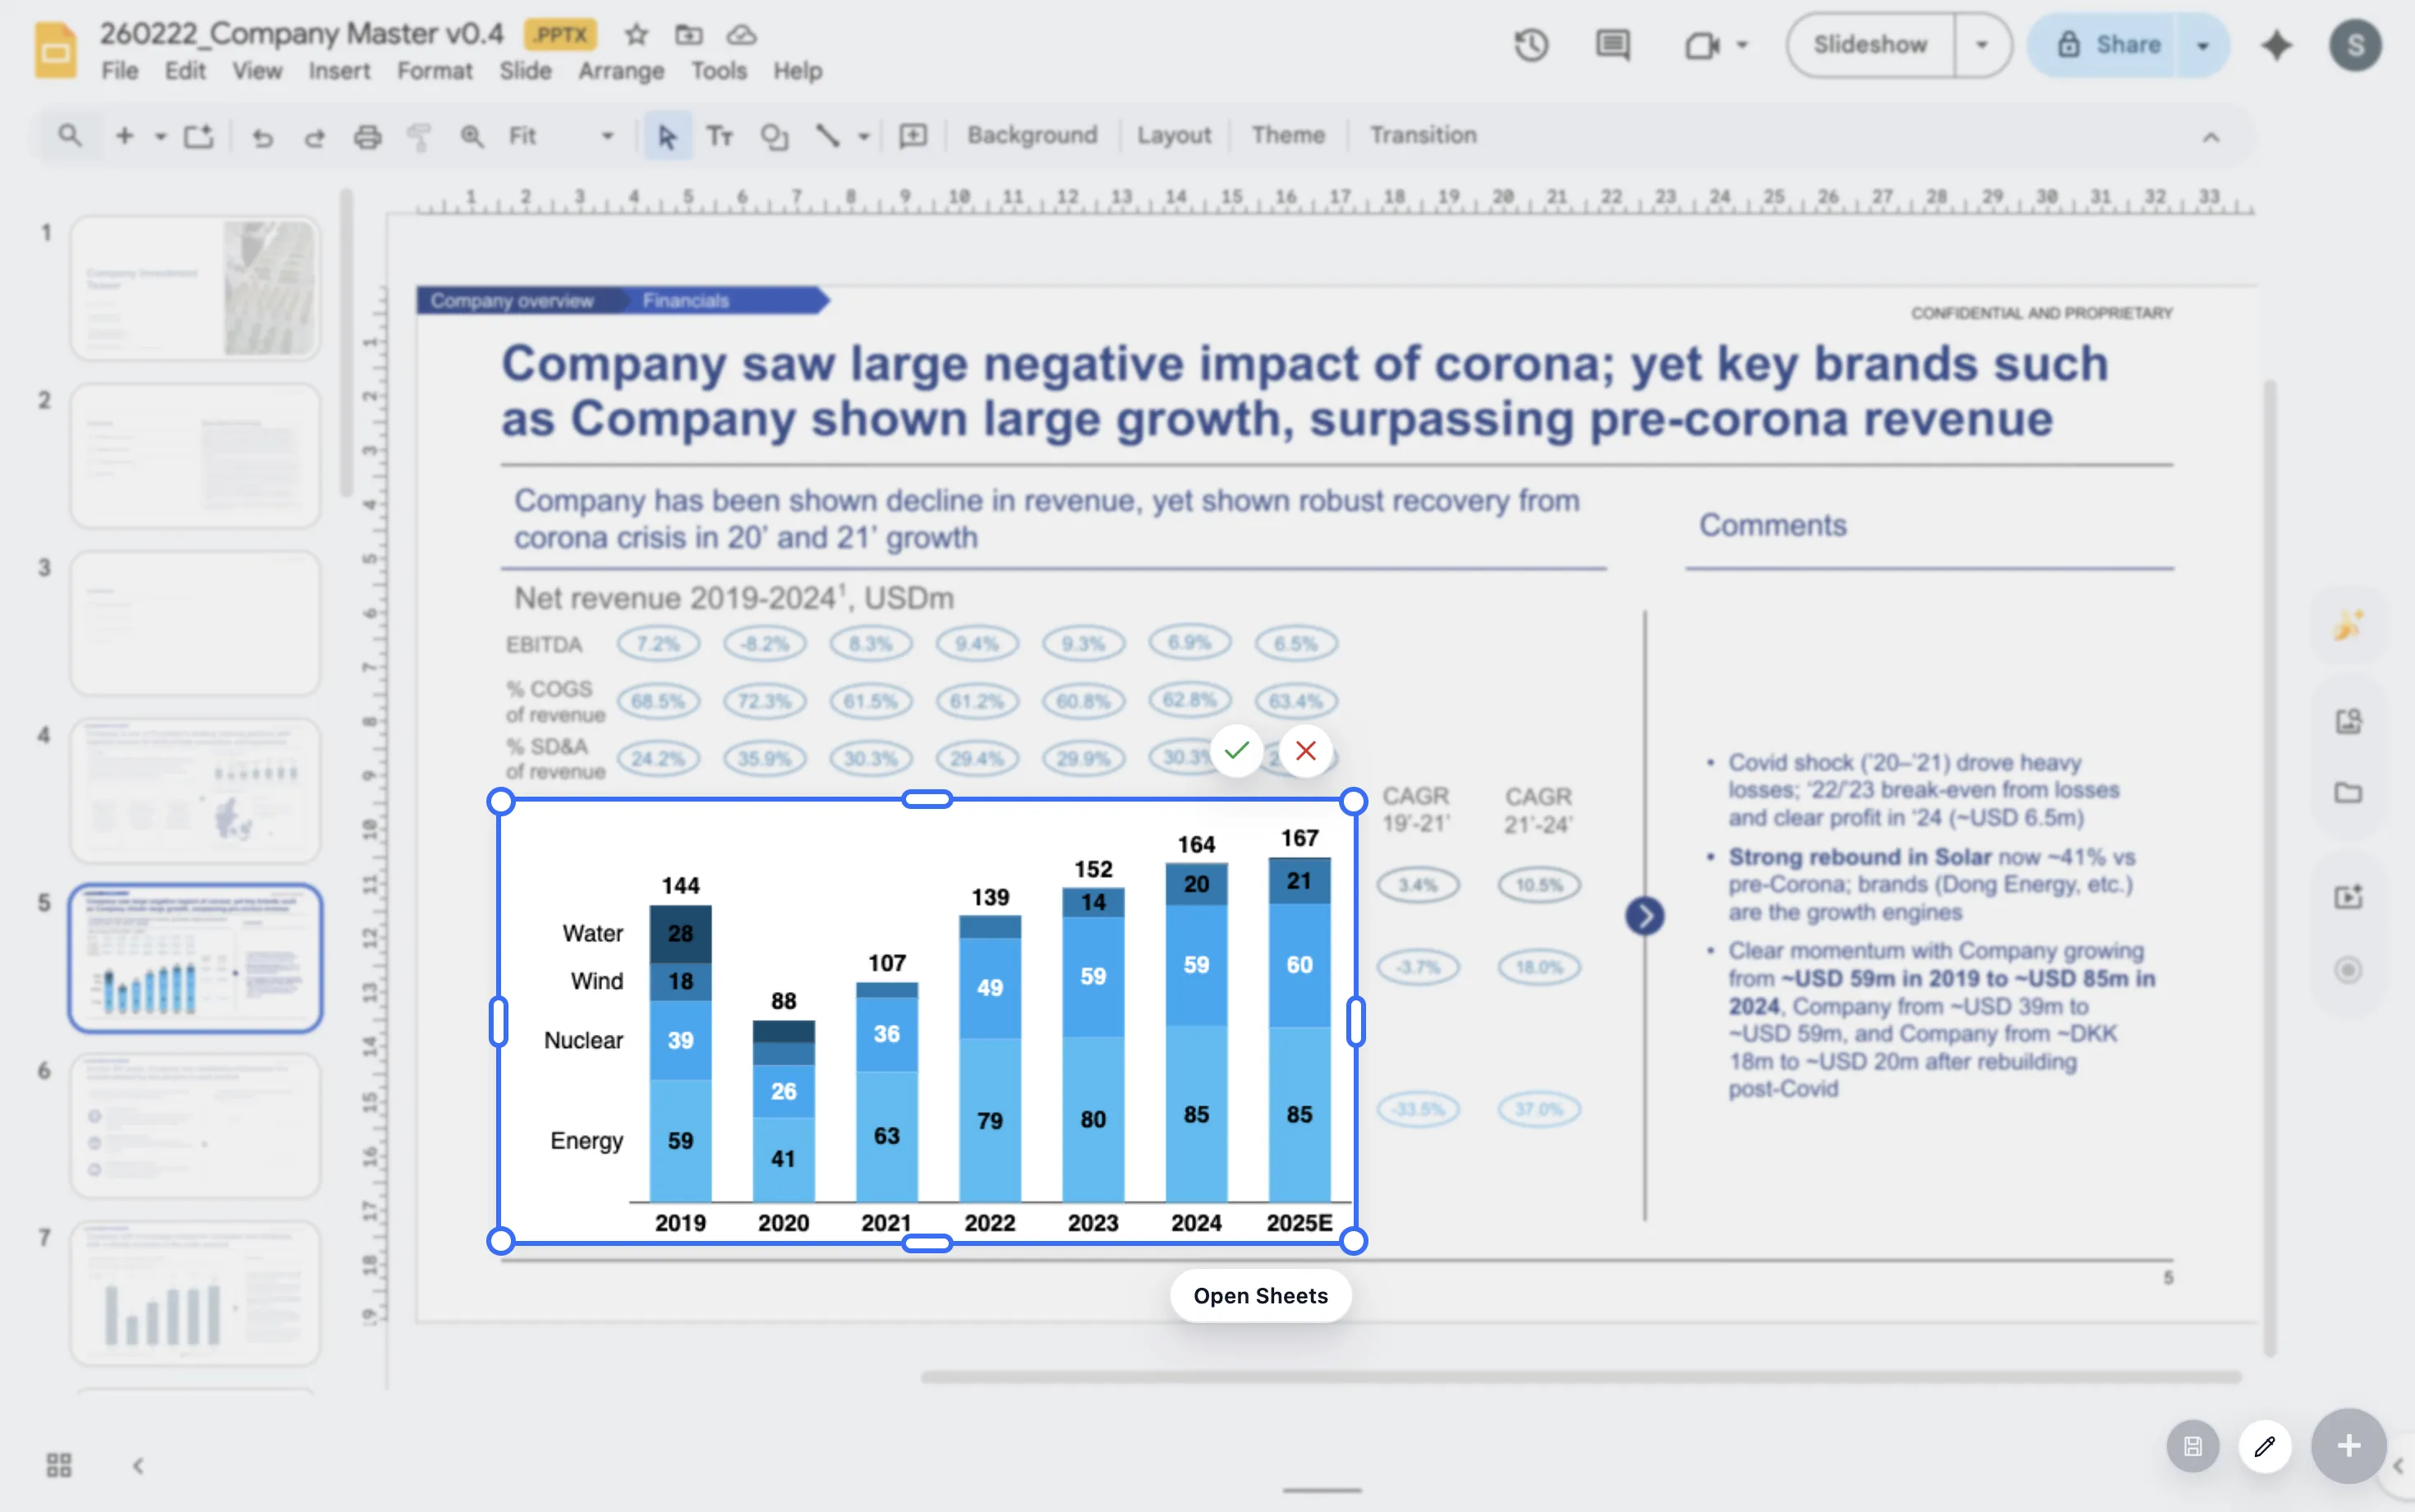
Use stacked bars when the composition of revenue, pipeline, costs, or headcount matters.
Lead magnet
Board chart selection checklist
Use this checklist before adding a chart to a board deck.
- Does the chart answer a board-level question rather than an analyst-level question?
- Can the headline stand alone if the chart is skimmed quickly?
- Does the chart show plan, prior period, or another useful reference point?
- Is the chart tied to a decision, risk, update, or request?
Create board-ready charts in Google Slides
For teams preparing recurring board materials, ChartKit keeps chart creation and chart edits close to the deck.
Where ChartKit fits
Build recurring board visuals without restarting every quarter
ChartKit fits teams that prepare board materials in Google Slides and need charts that can be updated across cycles. A clean chart structure can be reused as the company changes.
This is useful for revenue bridges, burn and runway trends, segment mix, headcount movement, and plan-versus-actual views.
FAQ
Common questions about board deck charts
How detailed should a board deck chart be?
Detailed enough to support the discussion, but not so detailed that the board has to decode the chart during the meeting.
Which charts are most useful in board decks?
Common patterns include plan-versus-actual line charts, revenue bridges, pipeline mix, headcount movement, and cash or runway trends.
Should every board chart include a recommendation?
Not every chart needs a recommendation, but every chart should have a clear reason for being in the deck.