Consulting decks
Google Slides chart maker for consulting decks
A consulting deck chart has to do more than display data. It has to support a recommendation, survive review cycles, and remain editable when the client or partner asks for changes.
Quick answer
For consulting decks in Google Slides, look for a chart workflow that supports repeat updates, consistent formatting, and clear storytelling controls. The tool should help you explain the point on the slide rather than force you back into a spreadsheet production loop.
Workflow fit
Consulting chart work is repetitive by nature
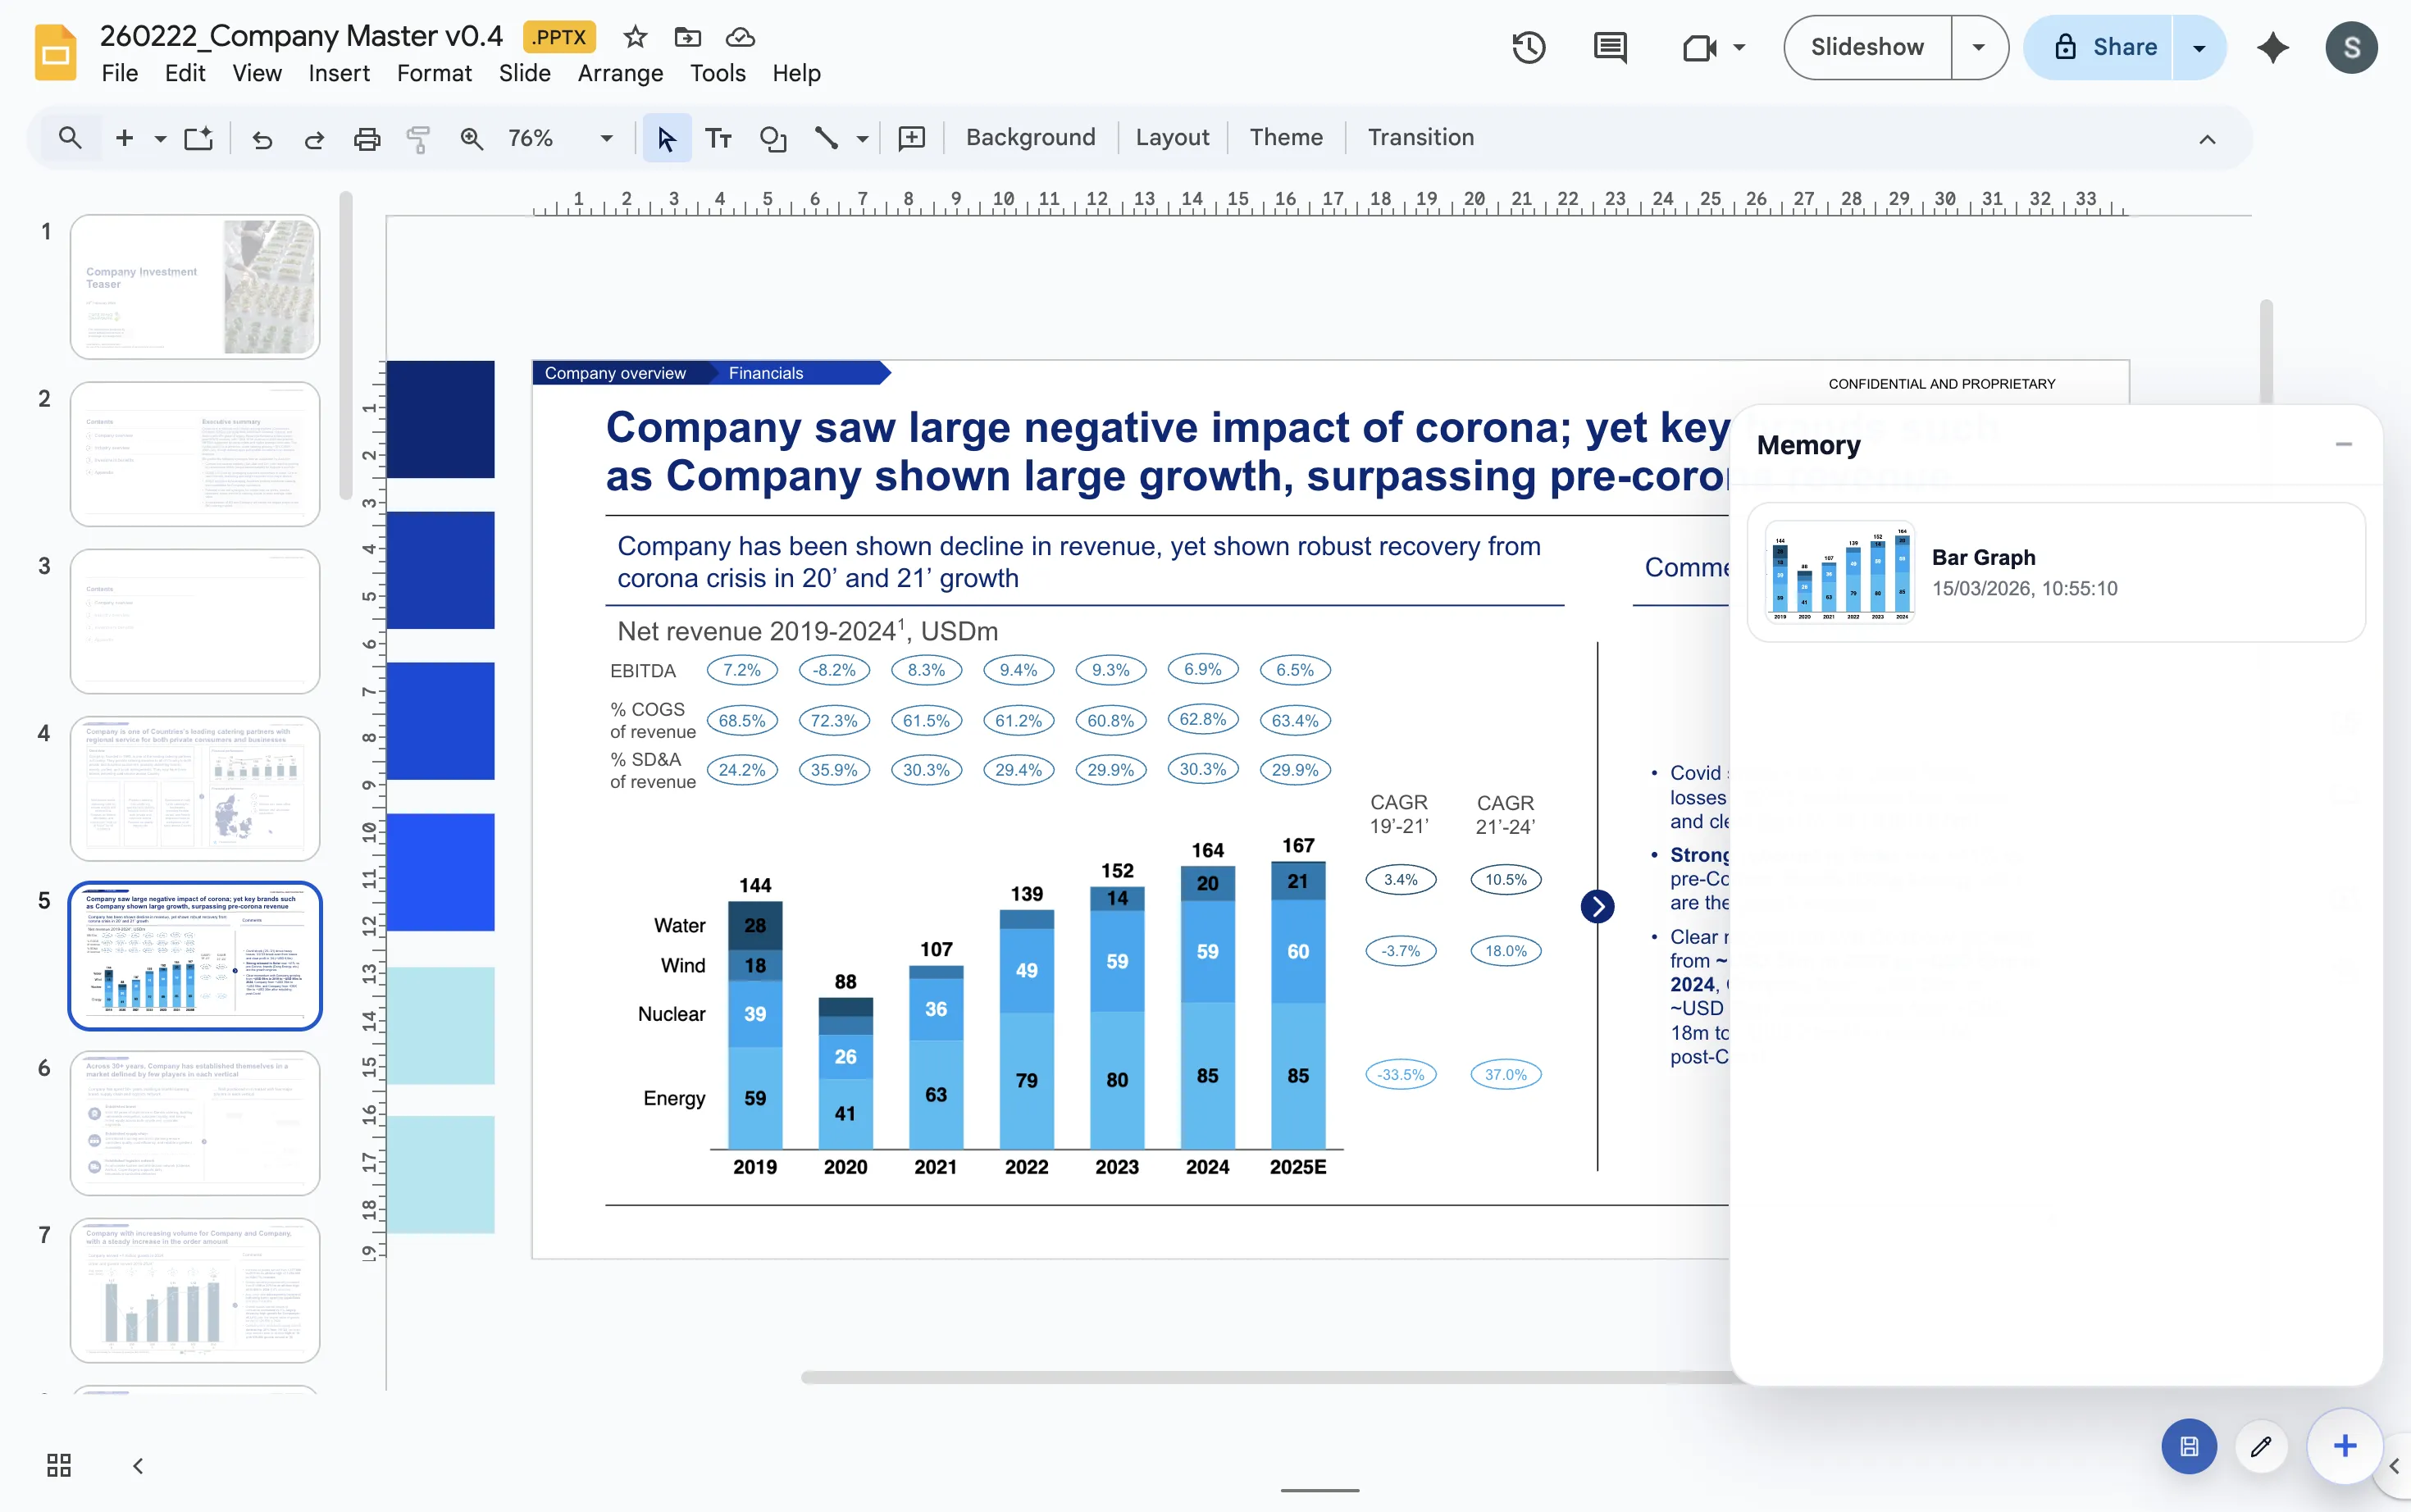
Most consulting teams rebuild the same chart patterns again and again. There are bridge charts for change, stacked bars for mix, line charts for trends, and comparison charts for options. The real value is not only creating one chart. The value is making the next twenty charts faster and more consistent.
That is why a Google Slides chart maker should be judged by workflow, not by a feature list alone. If the chart is hard to revisit, the team pays for that problem every time the deck changes.
Selection criteria
What consultants should check before choosing a chart workflow
Repeat updates
The workflow should make it easy to revisit a chart when the numbers or storyline change.
Deck consistency
Charts should follow a repeatable visual style across the whole document, especially in recurring client work.
Story controls
Totals, deltas, labels, and annotations matter because the chart has to make a point quickly.
Lead magnet
Consulting chart workflow checklist
Use this checklist when deciding whether a chart workflow is ready for client-facing consulting decks.
- Can a teammate edit the chart without rebuilding the source file?
- Does the chart type match the business question on the slide?
- Can labels, totals, and deltas be adjusted for the storyline?
- Can the same format be reused across a full workstream deck?
Build the chart where the recommendation lives
ChartKit keeps consulting-style chart work close to Google Slides, which makes review cycles easier to manage.
Where ChartKit fits
A good consulting chart stays editable in the deck context
ChartKit is built for teams that want consultant-grade chart communication while staying inside Google Workspace. The chart is created close to the slide, so the person editing the deck can judge whether the chart supports the argument.
This matters during review. A small label change, a different segment order, or a clearer delta can make the slide easier to defend without rebuilding the chart from zero.
FAQ
Common questions about consulting charts in Google Slides
What chart types do consulting decks use most often?
Common patterns include stacked bars, 100% bars, line charts, waterfall charts, variance charts, and simple before-and-after comparisons.
Why is editability so important in consulting decks?
Consulting decks change through review. If charts are static screenshots, small changes become slow and error-prone.
Is ChartKit a Think-cell replacement for every use case?
No. ChartKit is narrower. It is a practical option for Google Workspace teams that need the chart types and storytelling controls used in recurring business decks.