Consulting decks
Consulting chart examples for Google Slides
Consulting charts work best when they make a recommendation easier to understand. The format should follow the argument, not the spreadsheet.
Quick answer
Use bar charts for comparisons, waterfall charts for bridges, stacked bars for mix, line charts for trends, and annotated charts for key events. Keep each chart tied to one slide message.
Example library
Most consulting decks reuse a small set of chart patterns
A market entry deck, pricing deck, operating review, and cost program may look different, but the chart logic often repeats. Teams compare options, explain change, show trend, and isolate drivers.
Once those patterns are clear, teams can build faster and keep the deck more consistent. The point is not to make every chart look identical. The point is to use familiar structures for familiar questions.
Examples
Three consulting chart examples to reuse
Market mix
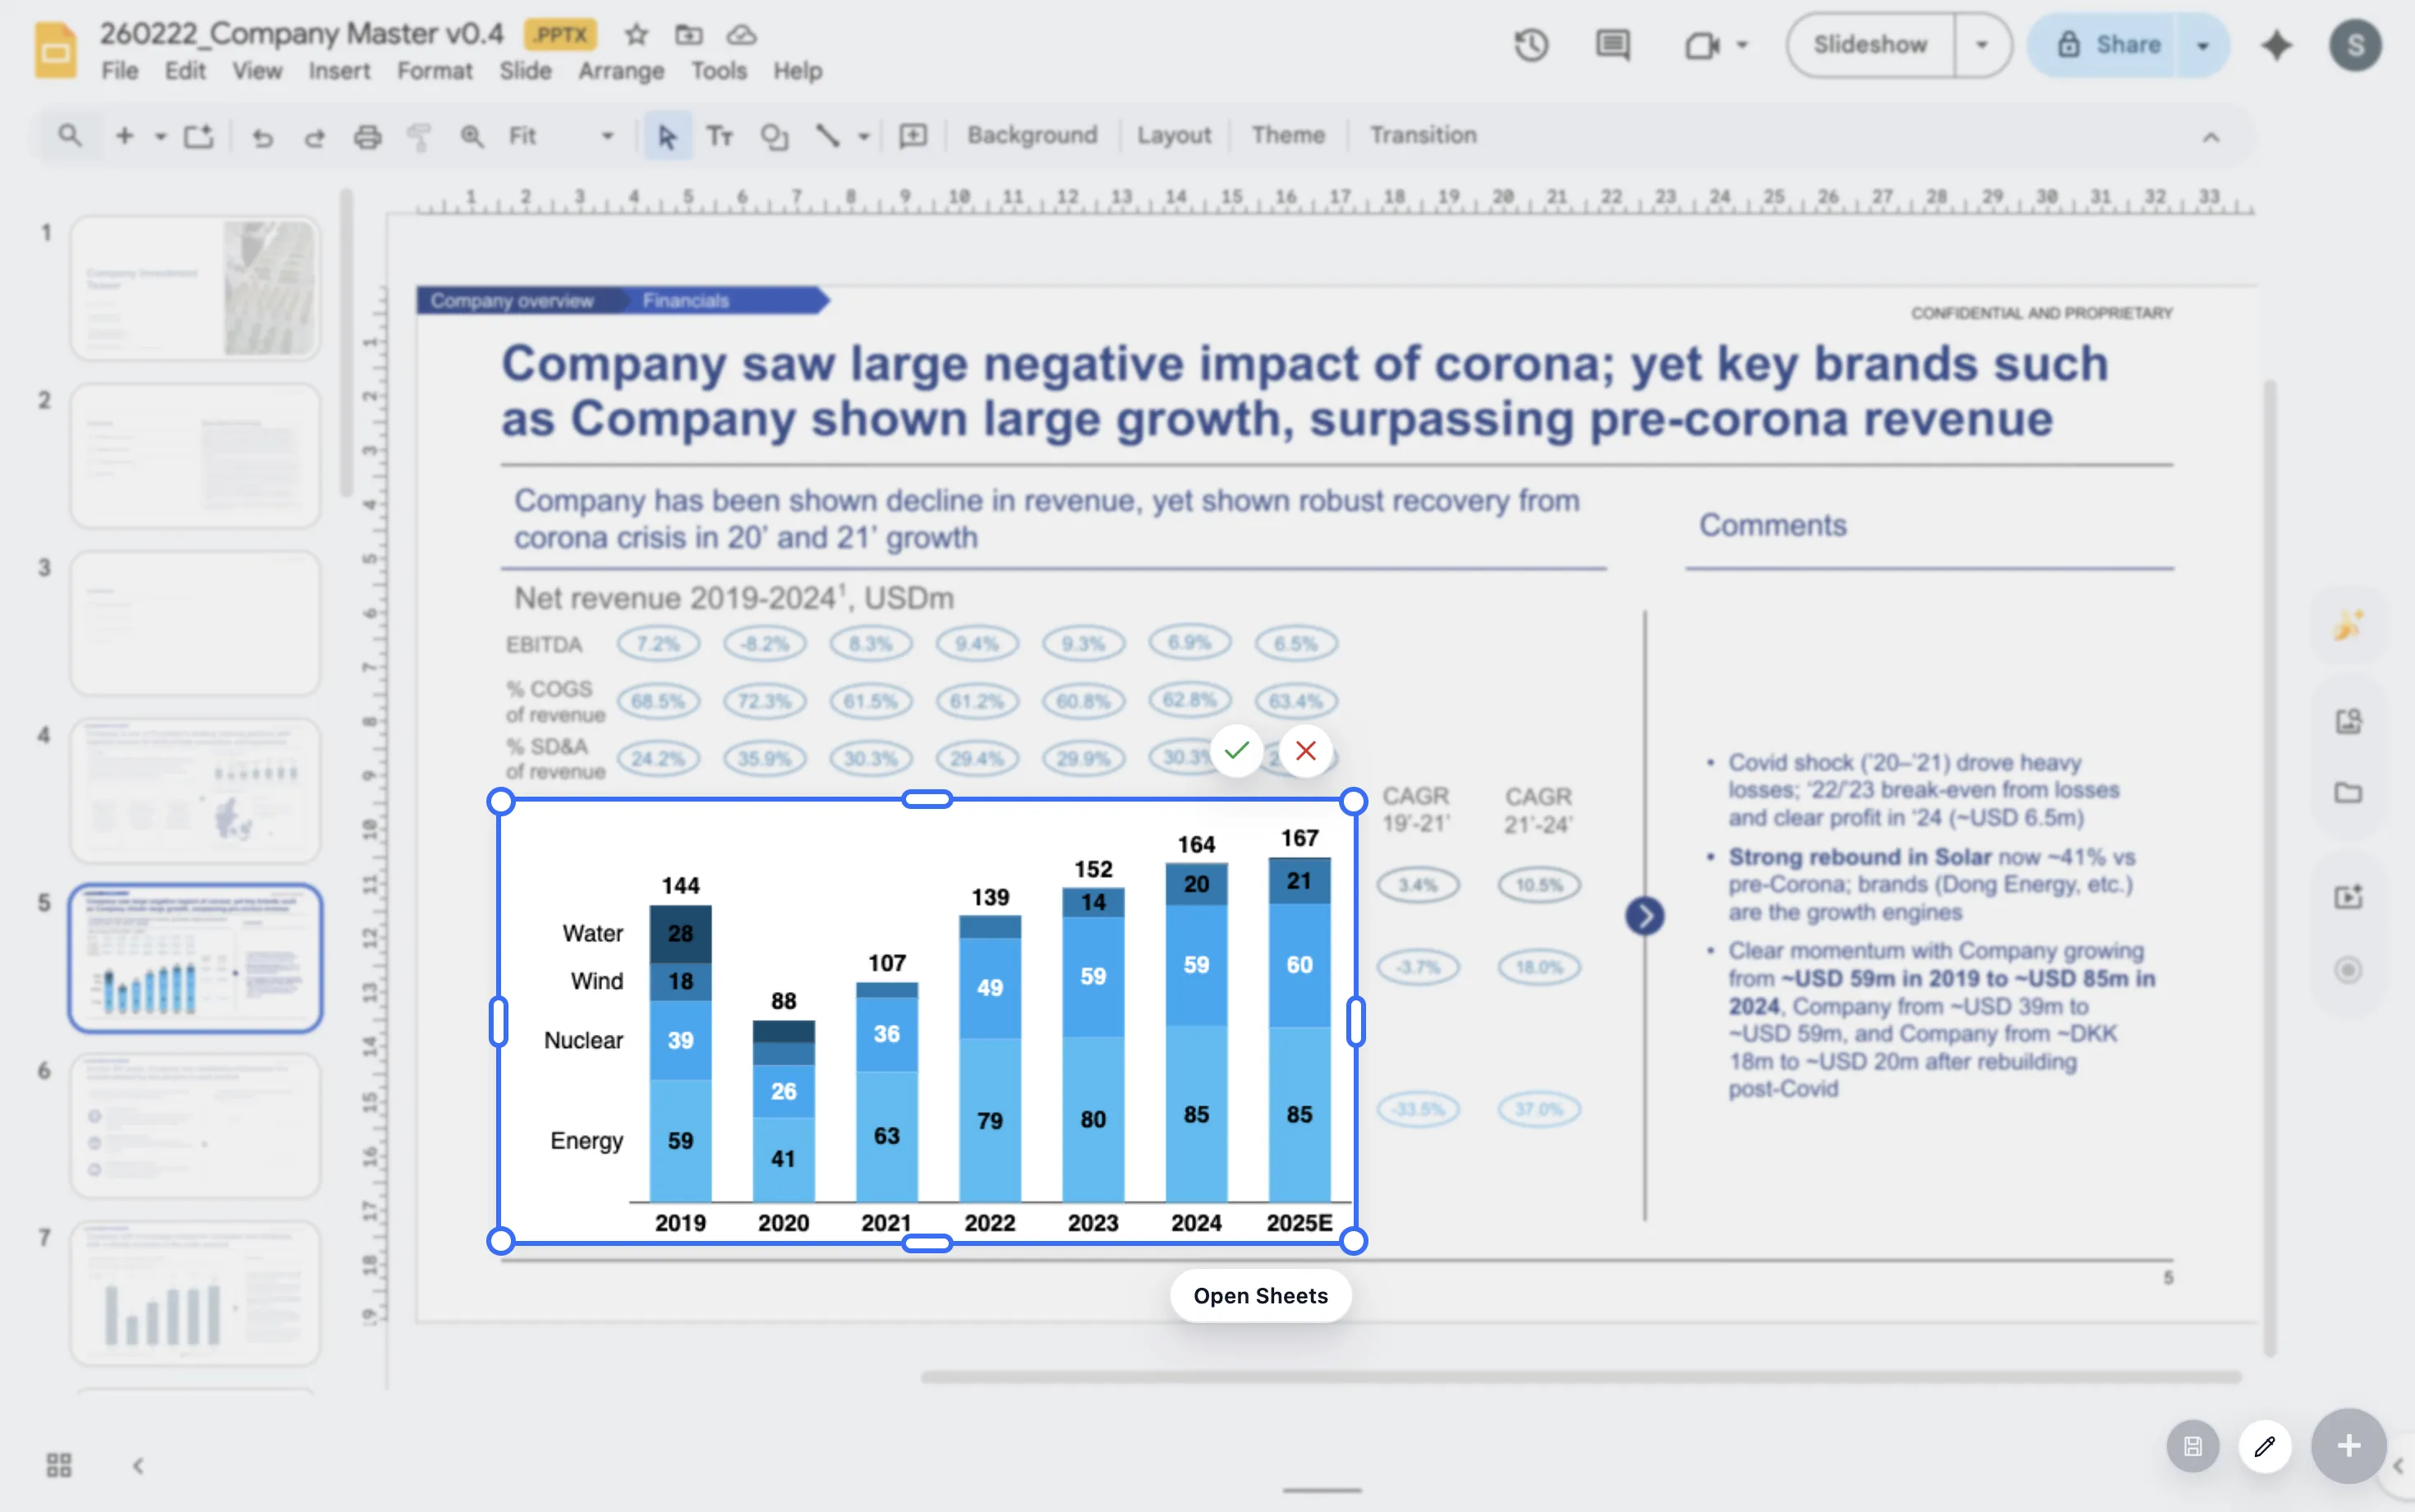
Use a stacked or 100% stacked bar to compare customer, region, product, or channel mix.
Profit bridge
Use a waterfall to explain how price, volume, mix, and cost drivers move profit.
Performance trend
Use a line chart to show improvement, slowdown, or divergence from plan over time.
Lead magnet
Consulting chart example library
Use this short library when choosing a chart for a consulting slide.
- Use a ranked bar for option comparison.
- Use a waterfall for revenue, cost, margin, or headcount movement.
- Use a stacked bar for mix and contribution.
- Use a line chart for trends, trajectories, and plan-versus-actual movement.
Create reusable chart patterns for your team
ChartKit helps consulting teams build polished chart patterns directly in Google Workspace.
Where ChartKit fits
Build repeatable consulting charts in Google Workspace
ChartKit supports the chart types that consulting teams often use in Google Slides, including stacked bars, 100% bars, line charts, and waterfalls.
This gives teams a practical way to create client-ready visuals without turning each chart into a separate production task.
FAQ
Common questions about consulting chart examples
What makes a chart feel consulting-ready?
It has a clear takeaway, a clean structure, selective labels, and formatting that supports the recommendation.
Should consulting charts include lots of detail?
Only when the detail supports the decision. Most slides improve when the main pattern is easier to read.
Can consulting charts be built in Google Slides?
Yes. ChartKit is designed for consultant-grade charts inside Google Workspace.