
What ChartKit's AI does in Google Slides, Docs, Gmail and PowerPoint
6 min read
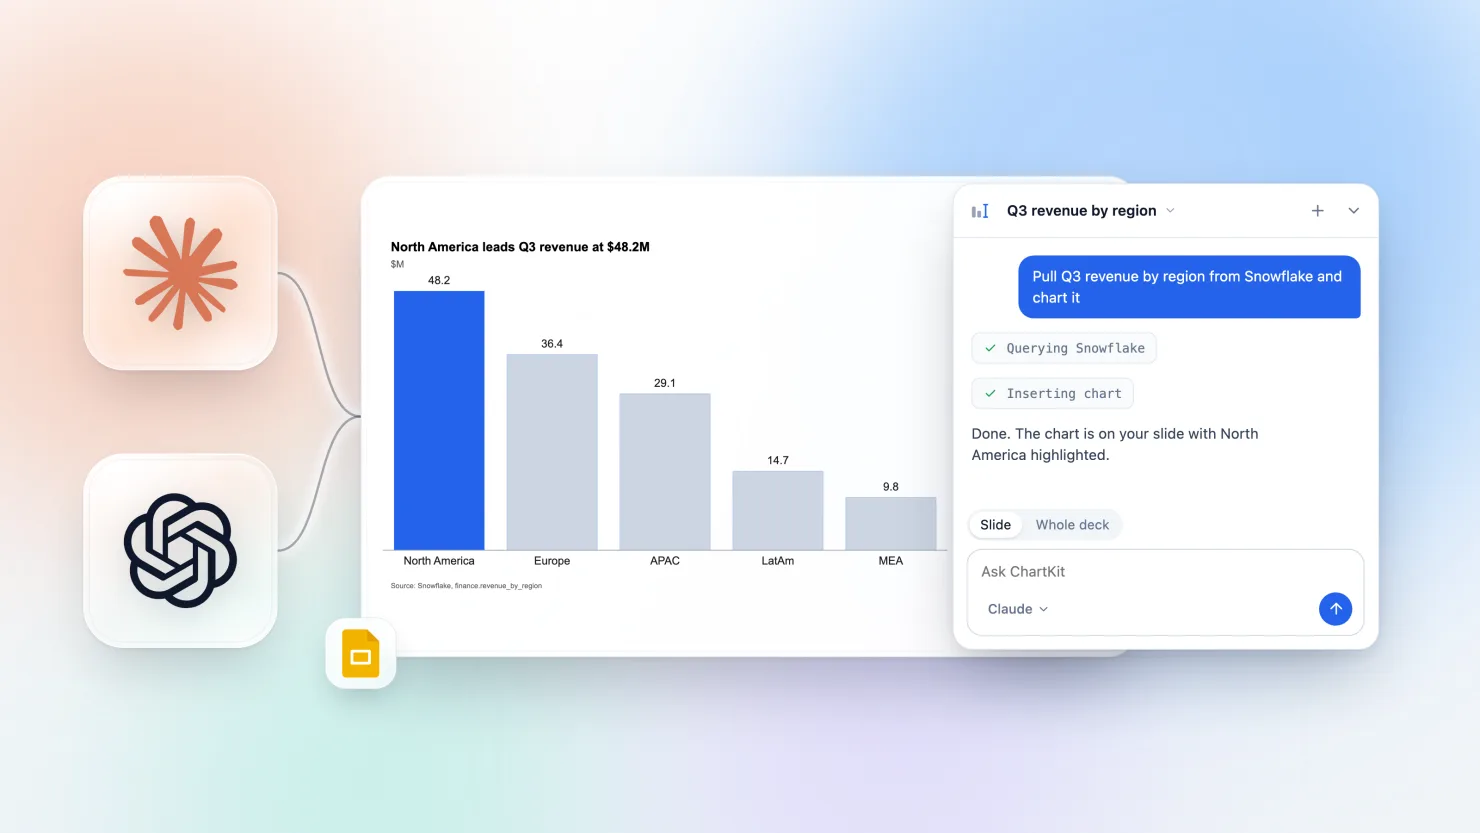
ChartKit's AI is one chat that can read your deck and edit it, plus a writing pill for text and a connector that lets Claude or ChatGPT draw charts straight into Google Slides. It runs in Google Slides, Docs, Gmail and PowerPoint. The newest piece is Fix slide, which reads the review feedback already on a slide and applies it. We make ChartKit, so read this with that in mind.
Here is each part, which model runs it, and what it does not do.
ChartKit Chat reads the deck and edits it
Open the command palette in Google Slides or the ChartKit menu in PowerPoint and ask. The chat has tools for the deck, so it works on what is on the slide instead of describing what you could do. It can:
- write and rewrite text on the slide
- insert a new chart or update one that is already there
- build a slide or replace the current one
- search your slide library and insert from it
In Docs and Sheets the chat has its own tools too. In Sheets it reads and writes ranges and opens the chart editor from a selection.
Prompts a consultant or finance lead might type:
- "Turn the table on this slide into a waterfall from FY24 EBITDA to FY25 and put the title in action-title form."
- "Update the revenue chart with the new Q3 figures and add a CAGR arrow from 2022 to 2025."
- "Find our standard risks slide in the library, insert it after this one and rewrite the bullets for the Nordic business."
The chat shows each tool step as it runs, so you see that it queried, inserted or rewrote.
Fix slide applies the feedback already on the slide
Review feedback on a slide comes in four forms: open comments, yellow sticky-note shapes, text boxes that start with TODO:, FIX:, Feedback:, Review:, Note: or Comment: (or mention an @name), and ChartKit stickers with custom text. Fix slide reads all of them on the current slide, makes the edits, and says in one sentence what changed and what is still open.
Run it from the command palette (Alt+Shift+W, Option+Shift+W on Mac) while the slide you want fixed is open.
A worked example, with made-up notes. A partner has left four notes on a market slide:
- A comment on the title: "Make this a takeaway, not a topic."
- A sticky note next to the chart: "Highlight APAC."
- A
FIX:box: "Add CAGR 2022 to 2025." - A comment on the source line: "Source is last year's."
Fix slide reads the slide and loads the chart's data. It rewrites the title as a sentence, highlights APAC in the chart, adds the CAGR annotation to the chart's anchors, and leaves the source line alone because it has no way to know the new source. It tells you that one note is still open.
A note that asks for a chart where it sits can be answered with a new chart at that spot, built from data the note names.
For comments, the reply matters. Fix slide replies in the thread to each comment it answered, with a summary of what its edit did. In PowerPoint on Mac it posts the reply into the native comment thread. PowerPoint does not let apps resolve a comment, so it reports which comments you still need to resolve yourself and does not read them as open feedback on the next run.
Fix slide only touches the slide you are on.
The writing pill rewrites text where you are typing
Select text in Google Slides, Google Docs, a Gmail compose window or PowerPoint, and a small pill appears. Its actions are:
- Improve: tighter, clearer wording
- Shorten: the same point in fewer words
- Action title: a topic title becomes a takeaway sentence
- Write: draft text from a prompt, available with no selection
The result comes back as a card with a word-level diff. Shorter, Longer, Formal and Casual re-run the result in place. Then you choose Replace, or Insert below. In Gmail the pill covers writing and improving the email body and does not offer Action title. The pill does not open a chat.
Ask AI in the chart editor changes the chart you have open
Inside the chart editor, Ask AI opens the chat with a draft prompt already pointed at that chart. The chat can read the chart's data and spec and change it: swap the chart type, patch an annotation, fix a number format. For a custom chart that fails to render, there is an "Ask AI to fix" action. It works on every surface the editor runs on.
The Claude connector draws charts from Claude or ChatGPT
If you already work in Claude or ChatGPT, you can skip the ChartKit chat. Connect ChartKit once, ask for a chart in plain language, and ChartKit draws it in your saved palette with one number format and sensible labelling. When you ask for it in your deck, it is inserted into a Google Slides deck you have open. Later you can ask for changed numbers, type or highlight and the chart on the slide refreshes. Details are on the Claude connector page, and the longer guide to making charts in Claude or ChatGPT covers this route.
The connector needs the ChartKit extension signed in on the same Google account and is part of Pro, with a 14-day trial.
Which model runs it
| Plan | What runs the chat and pill |
|---|---|
| Free | ChartKit AI, ChartKit's hosted model. Text only, with a daily limit. |
| Pro | Your own Claude or ChatGPT plan, through the ChartKit desktop app. No model bill from ChartKit. |
| Enterprise | Your own plan or the company AI gateway. |
On Pro, the ChartKit desktop app runs Claude Code or Codex on your computer and ChartKit talks to it locally. Your usage counts against your Claude or ChatGPT plan, and when you reach its limit the chat tells you when it resets and offers the other provider. On Enterprise, an admin can point chat and the pill at a company AI gateway such as Langdock, and members then need no desktop app. Pro and Enterprise prices are on the pricing page.
ChartKit does not train models on your data. On your own plan, requests go from your computer to your own session, not through ChartKit servers.
What it does not do
- ChartKit AI reads text only. Attach an image to the chat and it refuses.
- The Claude connector inserts into Google Slides, not PowerPoint.
- Chat on your own Claude needs the desktop app installed and signed in to Claude Code or Codex.
- Fix slide works on one slide at a time.
- Fix slide cannot resolve PowerPoint comments, and posting replies into PowerPoint comment threads is built for Mac only.
- The free plan's AI has a daily limit, and it is not the same model you get on your own Claude plan.
- Charts that Claude draws through the connector are rendered and stored on ChartKit servers.
How the pieces fit
Use the chat when the work is on a slide. Use Fix slide when someone else has already told you what is wrong. Use the pill for sentences. Use the connector when you are already in Claude and want the chart in your deck. For the PowerPoint side of the setup, see ChartKit in PowerPoint. For how it compares to the other options, see the best AI tools for Google Slides. The AI page lists the features in one place.