
How to make a Mekko (Marimekko) chart in PowerPoint on Mac
6 min read
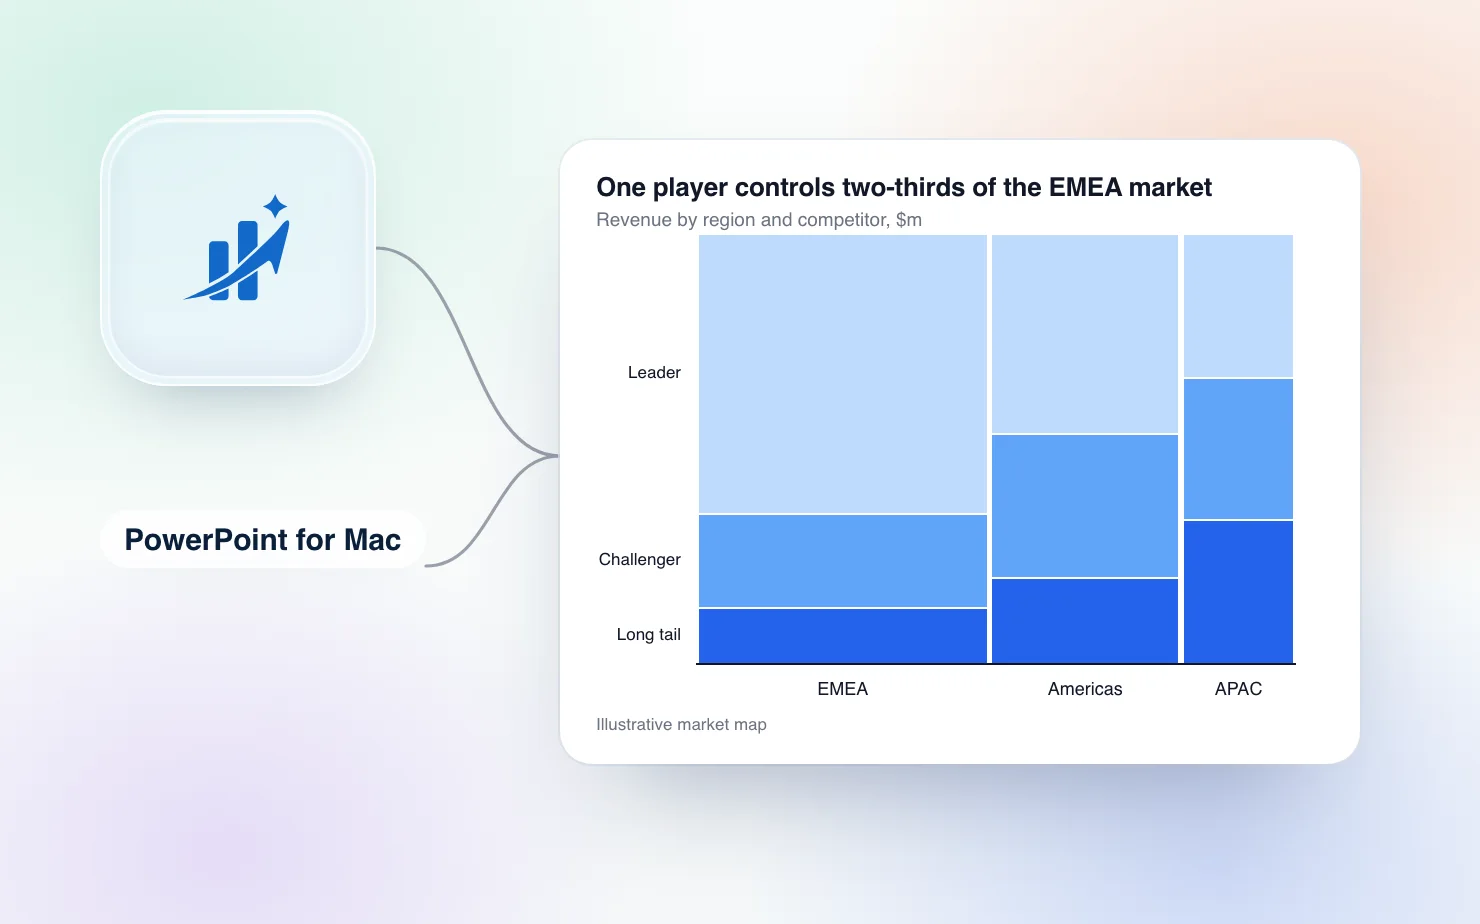
If you have been handed a market-map slide and told to "just make it a Mekko", you have probably already discovered that PowerPoint does not have one. The chart insert dialog lists columns, bars, lines, waterfalls and a treemap. It does not list a Mekko chart.
This article covers what a Mekko is, the two manual ways to build one in PowerPoint on a Mac, why both are painful, and how ChartKit in PowerPoint builds one for you as native shapes you can keep editing.
What a Mekko chart shows
A Mekko (or Marimekko) chart is a stacked bar chart where column width carries data too.
- Column width is the size of the segment. For example, each region's share of the total market.
- Stack inside the column is the composition of that segment. For example, each competitor's share of the region.
The area of every block is proportional to its absolute value. That is why the chart shows up on market-sizing and portfolio slides. A wide column with one tall block is a big market with a clear leader. A narrow column split many ways is a small, fragmented one.
It works best with up to about six columns and five segments. Beyond that, labels stop fitting and area comparisons get hard to read.
Why PowerPoint cannot just do it
A standard 100% stacked column chart gives every column the same width. A Mekko needs widths that follow your data. PowerPoint has no chart type or setting that calculates this. Empowersuite's guide to Marimekko charts in PowerPoint says the same thing. PowerPoint does not provide a true native Marimekko chart as a standard chart type, and it does not offer a feature that handles the width and area logic automatically.
So you have two options on a Mac before you reach for a tool.
Manual method 1: draw rectangles
This is the method most people end up with. A Mekko is geometrically just rectangles, so you calculate the sizes and draw them.
- In Excel or a spreadsheet, work out each column's width as a share of the total market. Then work out each block's height as a share of its column.
- Decide on a fixed chart frame on the slide. Say it is 20 cm wide and 12 cm high. A column with 35% of the market is 7 cm wide. A block with 40% of that column is 4.8 cm high.
- Insert a rectangle for every block (Insert, Shapes, Rectangle). Type the width and height into Shape Format, then position each one so the edges touch. View, Guides and Grid and Guides help with alignment.
- Colour the rectangles by segment so the same competitor has the same colour in every column.
- Add text boxes for the labels, the column totals above the columns, and a legend.
It is accurate, because the maths is honest. The problem is what happens next. A new quarter's numbers mean recalculating every width and height and resizing every rectangle by hand. Labels that fit in a wide column do not fit in a narrow one, so you shrink fonts or move labels outside one at a time. Nothing links the shapes to the data, so the numbers on the slide and the numbers in your spreadsheet only stay in sync because you are careful.
Manual method 2: a column chart with repeated categories
If you want a real chart object behind the slide, there is a workaround that fakes variable widths using a 100% stacked column chart.
- Set the gap width to 0% so the columns touch.
- Make every column the same unit width, such as 1% of the market.
- Repeat each category as many times as its width in percent. A region with 35% of the market becomes 35 identical columns. A region with 15% becomes 15.
- Fill in the data sheet row by row, one row per repeated column, with the segment shares for that region.
- Delete the axis labels, then add the region names as text boxes underneath.
The result looks like a Mekko, and PowerPoint draws the blocks for you. The cost is a data sheet with 100 rows that only you understand, region labels that are still text boxes, and a chart that falls apart the moment someone edits one row. If a segment's width changes from 35% to 38%, you add three rows and copy the values into them. Most people try this once.
Build it with ChartKit in PowerPoint
ChartKit is a desktop app for Mac and Windows that puts its menu over PowerPoint. It is the same chart editor as the ChartKit extension for Google Slides, and Mekko is one of its chart types.
- Open your deck in PowerPoint for Mac and pick Mekko from the ChartKit menu.
- Enter your data in ChartKit's data sheet. One axis is the columns, with their sizes. The other is the segments inside each column.
- ChartKit calculates the widths and heights and draws the chart on the slide. Totals, labels and the legend are generated with it.
- Click the chart on the slide to reopen it in the editor. Change a number in the data sheet, and the whole chart re-flows. Click away and the edit is saved back into the slide.
The chart lands as a group of native PowerPoint shapes (rectangles, lines and text boxes), not a picture. Anyone who opens the deck sees normal shapes. They can recolour or nudge them with PowerPoint's own tools, with or without ChartKit. You can reopen and edit any chart you made, right on the slide.
Two things to know. The chart is not linked to an Excel file, so the data lives in ChartKit's data sheet. And on a Mac the app needs two macOS permissions, one to control PowerPoint and one to see where the chart is on screen. The setup window walks you through both. Windows needs no permissions.
If your market map needs more than the chart, ChartKit also builds the stacked bars, waterfalls and totals that surround it in the same deck, and you can add CAGR arrows to them.
When to skip the Mekko
A large share of Mekko slides do not need one. If the segment sizes are roughly similar, or the absolute size is already on another slide, a 100% stacked bar with a total above each column tells the same composition story without the geometry. Check whether the width dimension is doing real work on your slide before you build it.
Other ways to get a Mekko into PowerPoint
On a Mac, think-cell has supported PowerPoint for Mac since version 10 in 2019 and builds Mekko charts. TrustRadius lists it at $298.80 a year for one to four users, and the vendor does not publish an official price table. The full comparison is in think-cell alternative for PowerPoint on Mac, and PowerPoint chart add-ins for Mac covers the other options. If your team works in Google Slides instead, the same chart is covered in how to build a Mekko in Google Slides.
We built ChartKit, so test it against your own market map before you decide.
Try it
ChartKit runs on PowerPoint for Mac (Microsoft 365), with separate downloads for Apple silicon and Intel. It also runs on PowerPoint for Windows (Microsoft 365, Windows 10 and 11). It uses the same account and plan as the Chrome extension. The Free plan covers 10 charts a month, no card. Pro is €10 a month or €100 a year, with a 14-day trial.
Download ChartKit and build your first Mekko on a sample deck. ChartKit is not affiliated with Microsoft.