
How to make a waterfall (bridge) chart in PowerPoint on Mac
6 min read
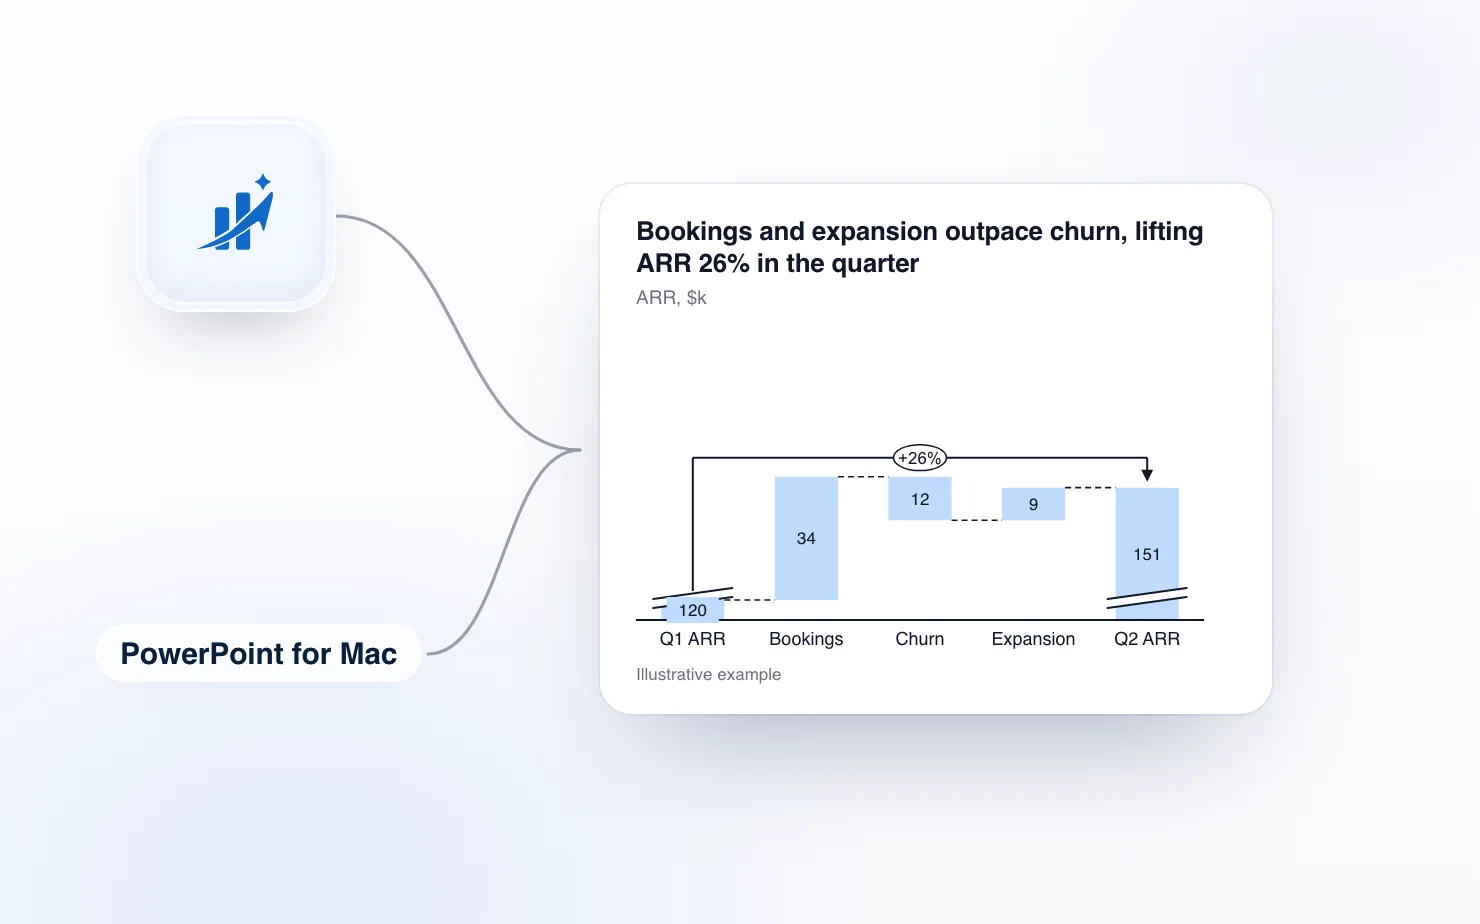
PowerPoint for Mac can make a waterfall chart without any add-in. If you have seen advice that says it cannot, that advice is about Google Slides, or about PowerPoint before 2016.
So this article starts with the built-in chart, because for a quick bridge it is often enough. Then it covers where it gets in the way, and how ChartKit in PowerPoint draws the bridge as native, editable shapes.
What a waterfall chart needs
A waterfall (also called a bridge or a walk) shows how a starting number reaches an ending number. Each bar is a step up or down, and the bars float on top of each other. A management-grade one has:
- floating bars that start where the previous bar ended
- total and subtotal bars that sit on the baseline
- connector lines between bars
- one colour for increases, one for decreases and a neutral one for totals
- value labels on every bar
A column chart missing the connectors and totals is only a column chart.
Method 1: the built-in waterfall
- In PowerPoint, open the slide and choose Insert, then Chart.
- In the Insert Chart dialog, choose Waterfall in the left-hand list and click OK.
- PowerPoint places a sample chart on the slide and opens a data sheet. Replace the sample categories and values with yours. Enter decreases as negative numbers.
- Close the data sheet.
- Mark the totals. Click a column once to select all of them, then click it again so only that column is selected. Right-click it and choose Set as total. Do the opening and closing columns, and any subtotal in between. Microsoft's own waterfall chart page describes the same Set as total option for Excel.
- To hide or show the connector lines, right-click the series, open Format Data Series and tick or clear Show connector lines.
If a connector looks slanted, the columns before a total do not add up to it. Check the numbers before you blame the chart.
It is a chart object, so you can edit the data later through the same data sheet. For a simple walk with a handful of steps, stop here.
Where it falls short for consulting-style bridges
The built-in chart gets awkward once the slide has to tell a story. Indezine's review of waterfall charts in PowerPoint 365 lists the pain points.
- Totals are set one column at a time. think-cell's guide makes the same point. When the structure of the bridge changes, you redo the totals.
- Annotation is limited. Indezine calls annotating waterfall charts "not an easy option, with very limited options." A difference arrow between the opening and closing bars, with the percentage on it, is something you draw by hand as separate shapes.
- Connectors cannot be formatted separately. Indezine notes you cannot format the connectors one by one.
- Negative labels always show a minus sign, and Indezine says you cannot hide it.
Those are the limits Indezine documents for PowerPoint 365 on Windows. PowerPoint for Mac uses the same chart type, but I have not confirmed each point against the current Mac build, so test the ones that matter to your slide.
The result is the usual consulting-deck loop. You build the bridge with the chart, then add arrows and callouts as separate shapes on top. The moment the numbers change, those shapes are in the wrong place.
Method 2: ChartKit in PowerPoint
ChartKit is a desktop app for Mac and Windows that puts its menu over PowerPoint. It is the same chart editor as ChartKit for Google Slides.
- Open your deck and choose Waterfall from the ChartKit menu.
- In ChartKit's data sheet, enter the steps as signed numbers. Positive is an increase, negative is a decrease.
- Mark the opening and closing values as totals. Subtotals work the same way.
- Add a difference arrow between two bars to show the change and its percentage.
- Click away. The edit is saved into the slide.
The chart lands on the slide as a group of native PowerPoint shapes. That includes the bars, the connectors, the labels and the difference arrow. Anyone opening the deck sees normal shapes and can recolour or nudge them with PowerPoint's own tools, with or without ChartKit.
When the numbers change, click the chart on the slide to reopen it in ChartKit's editor. Edit the data sheet, and the bars, connectors and arrow move together. Click away and it is saved back. The difference arrow is drawn from the bars it points to, so you do not reposition it by hand.
ChartKit is not linked to an Excel file, so the numbers live in ChartKit's data sheet. You can reopen and edit any chart you made, right on the slide.
Tips for a bridge that reads well, whichever tool you use
- Keep the number of steps under about eight. Group the small ones into an "Other" step so the labels stay readable.
- Order the steps by size or by logic, and use the same order every period so readers learn where to look.
- Use one colour for increases, one for decreases and a neutral one for totals, and keep them the same on every bridge in the deck.
- Put the message in the slide title. "Bookings and expansion outpace churn" says more than "ARR bridge".
- Check that the opening value plus the steps equals the closing total before you format anything.
Which one to use
Use the built-in chart when the bridge has a few steps, no arrows, and nobody will touch the numbers again. Use ChartKit when the slide needs totals in the middle, a difference arrow, or tidy labels, or when you will revise the numbers on every reporting cycle.
If your whole deck needs the same treatment, the same chart editor also builds Mekko charts and stacked bars with totals and CAGR arrows. The comparison with the incumbent is in think-cell alternative for PowerPoint on Mac, and PowerPoint chart add-ins for Mac covers the wider field. If your team uses Google Slides instead, see how to make a waterfall chart in Google Slides.
We built ChartKit, so build one bridge both ways with your own numbers and keep the one that survives your next revision.
Try it
ChartKit runs on PowerPoint for Mac (Microsoft 365), with separate downloads for Apple silicon and Intel. It also runs on PowerPoint for Windows (Microsoft 365, Windows 10 and 11). The same account and plan cover the Chrome extension for Google Slides. The Free plan covers 10 charts a month, no card. Pro is €10 a month or €100 a year, with a 14-day trial.
Download ChartKit. Setup takes four steps on a Mac, including two macOS permissions, and three steps on Windows with no permissions. ChartKit is not affiliated with Microsoft.