
Stacked bar charts with totals and CAGR arrows in PowerPoint
6 min read
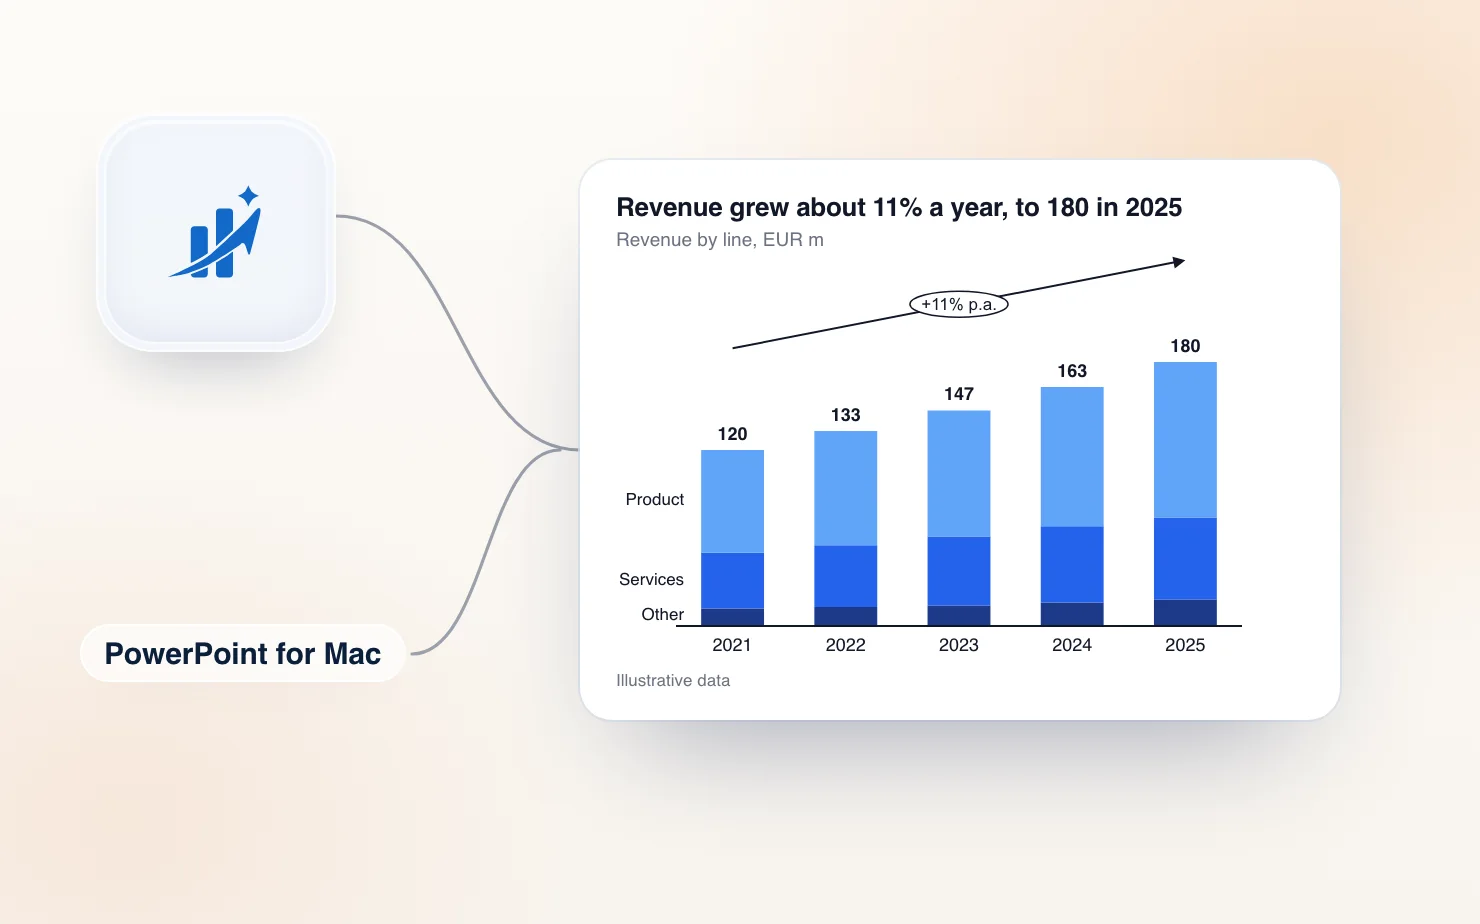
Two things on a stacked bar chart decide whether people can read it. The total above each column, and the growth rate that connects the first and last column. PowerPoint draws neither.
This article covers the manual way to get both, then how ChartKit in PowerPoint draws them as native shapes that stay in place when the numbers change.
Totals on a stacked bar chart
A stacked column chart labels each segment, but not the column as a whole. The usual fix is a helper series.
- Insert a stacked column chart (Insert, Chart, Column, Stacked Column). Enter your data in the data sheet, one series per segment.
- Add one more column to the data sheet called Total. In each row, enter the formula that adds the segments, such as
=SUM(B2:D2). - Right-click the chart, choose Change Chart Type, and set the Total series to a line chart. Alternatively, keep it as a stacked column and give it no fill.
- Turn on data labels for the Total series and place them above or inside end.
- If the helper is a column and you used no fill, the invisible bars double the height of the axis. Set the axis maximum by hand so the chart is not half empty. Delete the Total entry from the legend.
This works, and many decks rely on it. The upkeep is where it hurts. The Total column is a formula in the data sheet, so every row you add needs it copied down. Someone who inserts a segment later can forget it is there. And the axis maximum you fixed by hand stops fitting when the numbers grow.
CAGR arrows, by hand
CAGR is the compound annual growth rate. It answers one question: what steady yearly growth rate would take you from the first column to the last?
The formula is (ending value / starting value) ^ (1 / number of periods) - 1. A worked example with a tiny dataset:
| Year | 2021 | 2022 | 2023 | 2024 | 2025 |
|---|---|---|---|---|---|
| Total revenue | 120 | 133 | 147 | 163 | 180 |
- The start is 120 and the end is 180, so the ratio is 180 / 120 = 1.5.
- From 2021 to 2025 is four periods, not five. You count the steps between the columns.
- 1.5 to the power of 1/4 is 1.1067, and subtracting 1 gives 0.1067.
- CAGR is about 10.7% a year.
The most common mistake is dividing by the number of columns instead of the number of periods. With five columns, that would give a wrong rate of 8.4%.
In PowerPoint, the arrow itself is a manual job. Ampler describes the usual workflow as calculating CAGR in Excel and pasting it into a text box that must be re-pasted every time the numbers change. In practice:
- Calculate the CAGR in a spreadsheet and keep the cell next to your data.
- Draw an arrow or a bent connector above the chart from the first column to the last (Insert, Shapes).
- Add a text box or a rounded rectangle on the line and type the percentage.
- Line up the arrow ends with the top of the first and last columns. Zoom in and nudge with the arrow keys.
- Group the arrow and label so they move together.
Then the numbers change. The total moves, the arrow is now pointing at the wrong place, and the percentage in the text box is stale. You redo steps 1 to 4. This is the weak point, because the arrow is not connected to the chart at all.
Totals and CAGR with ChartKit in PowerPoint
ChartKit is a desktop app for Mac and Windows that puts its menu over PowerPoint. It is the same chart editor as ChartKit for Google Slides, so the totals and CAGR arrows work the same way.
- Open the deck in PowerPoint and pick Stacked bar from the ChartKit menu.
- Enter the data in ChartKit's data sheet. One row per category and one series per segment.
- Turn on totals. There is no helper series to maintain, because the total is calculated for you.
- Add a CAGR arrow. Pick the first and last column and ChartKit calculates the rate from the data and draws the arrow and label above the chart.
- Click away. The chart is saved into the slide.
The chart lands as a group of native PowerPoint shapes. That covers the stacked bars, the total labels and the CAGR arrow. Anyone opening the deck sees normal shapes and can recolour or nudge them with PowerPoint's own tools, with or without ChartKit.
When the numbers change, click the chart on the slide to reopen it in ChartKit's editor, edit the data sheet, and click away. The totals update, the CAGR is recalculated, and the arrow is redrawn where the columns now end. You can reopen and edit any chart you made, right on the slide. ChartKit is not linked to an Excel file, so the data lives in ChartKit's data sheet.
The same editor also draws difference arrows between two columns, reference lines and axis breaks. Those are the next things you reach for on a deck of this kind. For arrow types in more detail, see how to annotate charts in Google Slides, which uses the same annotations.
Pick the arrow to match the question
Three annotations get mixed up on slides, so it helps to choose on purpose.
- CAGR arrow for a growth rate across several periods. Use it on a run of years.
- Difference arrow for the change between two specific columns, in absolute or percentage terms. Use it for year over year or plan against actual.
- Total for the size of each column, so the reader does not add segments in their head.
A slide with all three tells a reader the size, the step and the trend. A slide with only the bars asks them to work it out.
Which approach to take
If you have one chart and it will not change, the helper series and a drawn arrow are fine. Do it once and group the shapes. If the chart is revised every month, or if the same slide goes to five regions, the manual arrow is the part that costs you.
The comparison with the long-standing tool is in think-cell alternative for PowerPoint on Mac, and PowerPoint chart add-ins for Mac covers the others. The same editor builds waterfall charts and Mekko charts in PowerPoint.
We built ChartKit, so build one slide both ways with your own data before you decide.
Try it
ChartKit runs with PowerPoint from Microsoft 365 on Mac and on Windows 10 and 11. Mac has separate downloads for Apple silicon and Intel; one Windows installer covers x64 and Arm. The same account and plan cover the Chrome extension for Google Slides. The Free plan covers 10 charts a month, no card. Pro is €10 a month or €100 a year, with a 14-day trial.
Download ChartKit. Setup takes a few steps; on a Mac it asks for two permissions. ChartKit is not affiliated with Microsoft.