
ChartKit in PowerPoint on Mac and Windows: what it does and how it works
6 min read
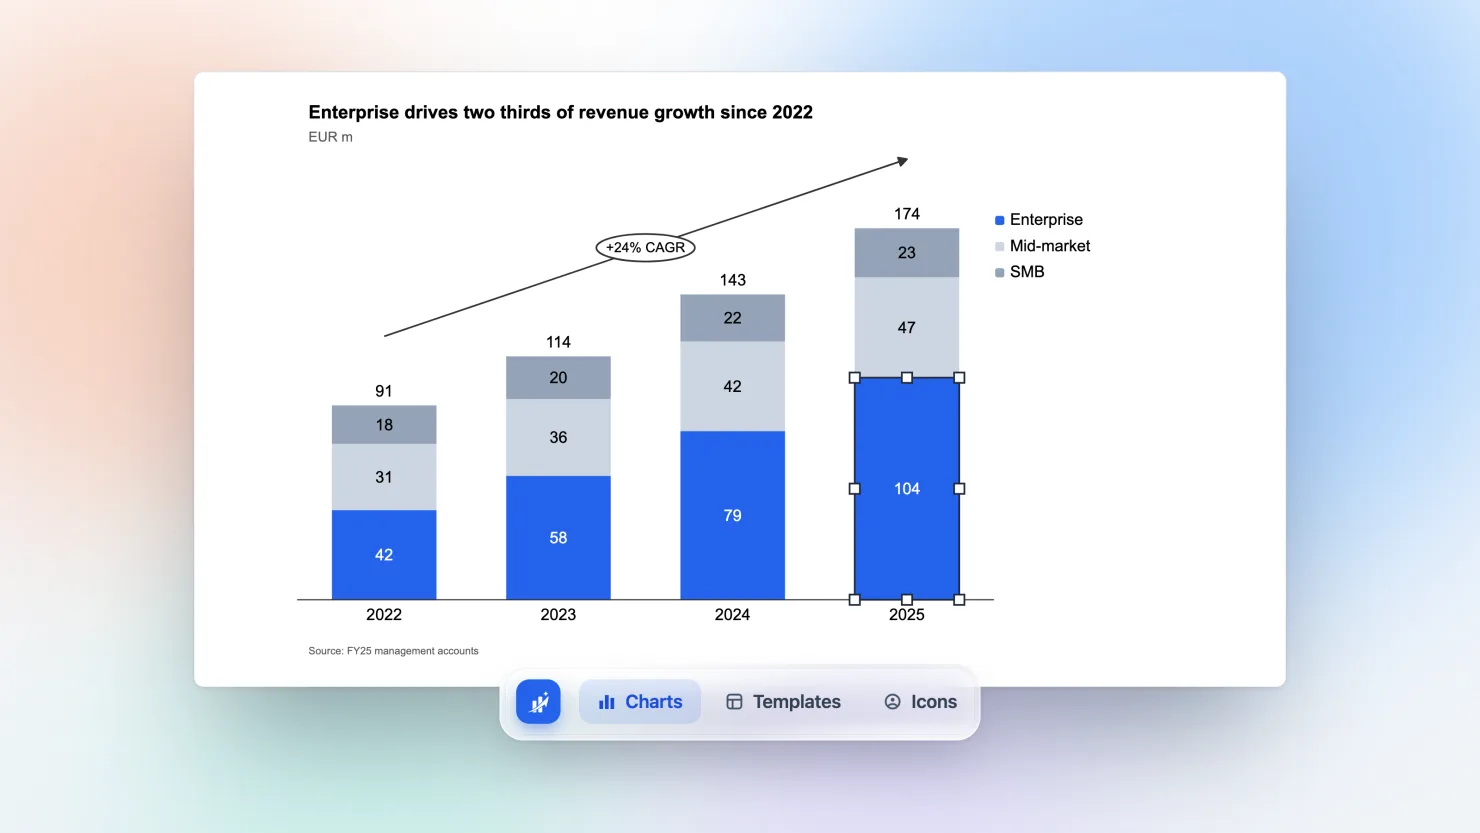
PowerPoint draws bar charts well enough. It does not draw the charts consultants and finance teams put in management decks. There is no Marimekko chart. A stacked bar has no total on top unless you add a hidden series. A CAGR arrow is a line, an arrowhead and a text box that you place by hand and fix every time the numbers change.
ChartKit in PowerPoint fills those gaps on Mac and Windows. We make ChartKit, so read this with that in mind. This post covers what it is, how it works, how to set it up, and where it stops.
ChartKit in PowerPoint is a menu over your slide
The ChartKit desktop app runs next to PowerPoint and puts its menu over the editing area. The menu has three tabs: Charts, Templates and Icons. You pick a chart type, type or paste the data, and the chart lands on the slide.
It is the same editor as the ChartKit extension for Google Slides. Same chart types, same annotations, same data sheet. You sign in once and one account and one plan cover both. It is not an Office add-in from a store. It is a desktop app that drives PowerPoint.
PowerPoint from Microsoft 365 is supported on Mac (Apple silicon and Intel) and on Windows 10 and 11.
Charts land as native shapes and reopen on click
Most chart tools paste a picture. ChartKit inserts a named group of rectangles, lines and text boxes. These chart types are drawn as native shapes:
- stacked, clustered and 100% stacked bars
- waterfall
- Mekko
- line
- scatter
- bubble
CAGR arrows and difference arrows are shapes too. Anyone who opens the deck can recolour a segment or move a label with PowerPoint's own tools. A colleague without ChartKit sees an ordinary slide.
Click a chart you made and ChartKit's editor opens over the slide. Click elsewhere and the change saves into the slide. A part that has no shape form, such as an icon, comes in as a picture.
The gaps from the top of this post are the reason most people try it. We covered each one separately: Mekko charts in PowerPoint on Mac, waterfall charts in PowerPoint on Mac and totals and CAGR on stacked bars.
Templates and icons come from the same menu
The Templates tab holds saved components and a slide library, so a chart style or a slide you built once is one click away in the next deck. The Icons tab searches the icon library and places an icon on the slide. Icons paste as pictures.
Icons, saved components and the slide library are part of Pro. The free plan covers charts.
AI in PowerPoint: Chat, Fix slide and the writing pill
Three AI features run in PowerPoint through the ChartKit desktop app. The ChartKit AI post has the full detail. Here is what they do on a PowerPoint slide.
ChartKit Chat. A chat panel that reads your deck and acts on it. You ask for a chart from data, a change to an existing ChartKit chart, a new slide or an item from your library, and it makes the edit on the slide.
Fix slide. Reviewers leave feedback on a slide, and Fix slide works through it. It reads yellow sticky-note shapes, text that starts with a tag such as TODO or FIX, and the open comments on the slide. It then applies the edits, including rebuilding a chart from new data. On Mac it also replies in the comment threads it answered. It cannot resolve a comment, so you resolve those in PowerPoint.
The writing pill. Select one text shape and a small pill appears. It improves, shortens or rewrites the text, or turns it into an action title, and you choose whether to replace the text or insert below it.
Free users get ChartKit AI, ChartKit's own hosted model. It is text only, so it cannot read images, and it has a daily limit. On Pro, you can run chat and the pill on your own Claude or ChatGPT plan, through Claude Code or Codex in the ChartKit desktop app, so ChartKit adds no model bill. Enterprise can point them at the company AI gateway. ChartKit does not train models on your data.
The Claude connector, which lets Claude or ChatGPT draw a chart from a prompt, inserts into Google Slides only. It does not insert into PowerPoint.
Setup takes three steps on Mac and two on Windows
Download the app from the PowerPoint page. The setup window is called "Set up ChartKit in PowerPoint".
On Mac:
- Sign in. The window opens your browser and signs you in.
- Connect PowerPoint. macOS asks whether ChartKit may control PowerPoint. Allow it. This is the Automation permission.
- Find charts on your slides. This needs the Accessibility permission, so ChartKit can see where a chart sits on screen. No Screen Recording permission is needed.
On Windows:
- Sign in.
- Connect PowerPoint. Windows asks for no permissions.
The Windows installer is not signed yet, so SmartScreen may show "unknown publisher". Choose More info, then Run anyway. PowerPoint and ChartKit must run as the same user, not as administrator. The Mac app is signed and notarized.
What it does not do
- It does not run in PowerPoint on the web or on iPad.
- It has no live links to Excel. The data sits in ChartKit's data sheet.
- Cmd+Z stays PowerPoint's own. It does not undo a ChartKit save.
- A chart part PowerPoint cannot draw as a shape lands as a picture, so recipients can move it but not recolour it.
- A colleague on another computer can edit the native shapes, but cannot reopen your chart in ChartKit's editor.
- ChartKit is not affiliated with Microsoft.
Pricing
The free plan gives you 10 charts a month, shared across Google Slides and PowerPoint, with no card. Pro is €10 a month or €100 a year, with a 14-day trial. Pro removes the chart limit and adds icons, saved components, the slide library and chat on your own Claude or ChatGPT plan. See pricing for the full table.
Who should stay with think-cell
Stay with think-cell if you already hold licences and your team works in it daily. It has years of depth across chart types, and it links charts to Excel, which ChartKit does not. If your workflow lives in a linked workbook, switching costs you more than it saves.
ChartKit fits if you build management-deck charts on a Mac or Windows PC, want native editable shapes, or switch between PowerPoint and Google Slides on one plan. The think-cell alternative comparison for Mac sets the two side by side.
Download ChartKit and make your first chart on the free plan.